When it comes to Google Analytics, a common question users ask is, “Where do I start?” They have logged into the tool multiple times and stared at the default report with its default timeframe of the last 30 days. They have pondered whether there was anything actionable buried in that curious “Avg. Time on Site” metric. (There is not.)
They have worked their way down the left-hand navigation: Audience Overview, Demographics, Sources Overview, Traffic Sources, Content Overview, Site Content, All Pages, Events, Top Events. No insights have emerged. They seemingly want a report that tells them how to change their sites to improve results.
Don’t Blame the Tool, or You
It is easy to blame the technology for not delivering specific recommendations. It is also easy to blame yourself for not knowing where to look for the reports that actually matter.
Both inclinations are misguided.
Effective analytics that actually drives results are based on a classic triangle of people, process, and technology.
Effective analytics are based on people, process, and technology.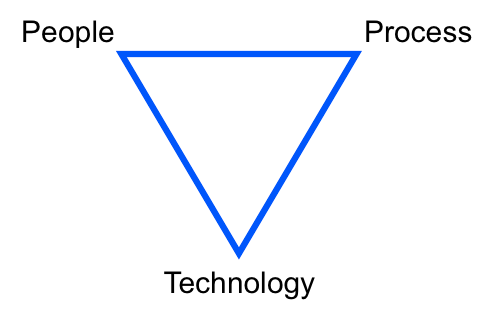
Google Analytics is a technology. You, the questions you come up with, and the analyses you conduct are the person. How you go about coming up with questions and conducting the analyses is the process.
All three of these components need to work in tandem to actually use data to drive meaningful results. While the technology is important, it is also, in some respects, the easy part. It is a technical project to get basic tagging in place, and Google has done a lot of work to make the implementation of base tagging straightforward. More advanced tagging is often needed, but that can often be accomplished through subsequent incremental efforts — each one a small technical project in its own right.
Once the basic data is captured, the real fun of finding value begins. But, that fun actually starts outside of Google Analytics.
Remember the Scientific Method?
You likely had a middle-school science teacher that taught the scientific method. The basics are used by scientific researchers. They start with a hypothesis, design an experiment or research to test that hypothesis, conduct the experiment, and then analyze the results to determine if it invalidates the hypothesis.
Using the basics of the scientific method as your core process for analytics is the most efficient way to get value from your technology, Google Analytics.
Hypotheses? Really?
Hypotheses is a fancy word — so is “analytics” — but it is a simple concept. A hypothesis is nothing more than an assumption that can be validated with data. The order matters — the data is at the end of the process. The assumption is articulated first.
So, where do assumptions come from? They are based on your experience, including data you have reviewed in the past, your own experience navigating your website, user feedback from your site, the comments your employees have made about the site, and countless other sources.
If you start with a good hypothesis, your navigation of Google Analytics becomes much more targeted and efficient because you know exactly what sort of data you need, and you can ask yourself up front if Google Analytics is likely to have that data, or if you need to look elsewhere.
What Makes a Good Hypothesis?
There are two characteristics of a good hypothesis.
- It is sufficiently specific to be reasonably tested and validated.
- It is an assumption that will drive action based on at least one of the different possible outcomes of its validation.
There is a relatively easy way to articulate hypotheses that will help ensure they meet these criteria. The trick is to state the hypothesis as two sentences with the following structure.
- I believe… X.
- If I am right, then I will take a specific action.
The second statement ensures that the first is sufficiently specific, and it ensures that you have thought through what action you will take if that belief holds up.
How Does that Work in Practice?
This all may sound somewhat abstract, so let’s look at some examples to see how it can be applied in practice.
-
Example 1. “I believe our website is bad. If I am right, I will make the website better.”
The statement is not a sufficiently specific hypothesis, although it is a statement people make all the time. The second statement cannot be reasonably completed, and the process of trying to complete it makes that clear.
-
Example 2. “I believe many people coming to our website are looking for coupons for our products and cannot find them. If I am right, I will add a more prominent link, called ‘Coupons and Deals,’ in our global navigation.”
This is a specific hypothesis. To quickly validate it with Google Analytics, you could go to the “Site Search” report and see how many searches for “coupon,” “coupons,” “deals,” “promotion,” and “discount” have occurred in the last month. You can also analyze whether the segment of visitors who search for these terms exit the site without reaching the coupon content.
-
Example 3. “I believe visitors from outside the U.S. convert at a lower rate because we do not show pricing in their local currencies. If I am right, I will implement functionality to detect where users are coming from and show an estimate of the local currency price next to the USD price for each product.”
This example has two hypotheses in it. The first is that visitors from outside the U.S. convert at a lower rate. The second is why this is the case. That’s okay. Google Analytics can quickly validate the first hypothesis — the “Ecommerce” metric group on the “Location” report shows how many visits and the conversion rate broken down by country. If the conversion rate is not substantially lower for non-U.S. visitors, you can move on to a different hypothesis.
If the first assumption is correct, however, you need to test whether displaying local currency will improve the conversion rate. Unfortunately, Google Analytics will help with that if you’re able to fully implement a local currency solution. Only then can Google Analytics show if the conversion rate for non-U.S. visitors improves. Instead, you may want to run an A/B test where you manually show some form of local currency to half of the visitors from a single country while not showing it to the other half of the visitors.
Not All Hypotheses are Easily Tested with Google Analytics
As the last example above shows, not all hypotheses can be tested with Google Analytics. But, by using the approach of articulating hypotheses up front, you can quickly determine if Google Analytics is the right tool for the job.
When Google Analytics can validate the hypothesis, you will be in and out of the tool much more quickly because you will know exactly what question you are trying to answer. Since you will have already articulated what action you will take depending on the answer, you won’t get bogged down sorting through the data. You will be primed to act on that information.