
Consumers are increasingly impatient when it comes to waiting for their web browsers to load content. Measuring and monitoring how long it takes pages on your site to load — from desktop computers, laptops, tablets, or smartphones — enable you to take corrective action when any one of dozens of site-slowing scenarios occurs.
The most cited recent statistic related to load times for ecommerce sites comes a study that Forrester conducted in 2009 on behalf of Akamai. It read, in part, “40 percent of shoppers will wait no more than three seconds before abandoning a retail or travel site.”
From that study, and from commonsense observations, we all know that load times affect a site’s revenue-generating potential. In this article, I’ll explain the factors that affect load times, and how to measure and monitor it all.
Drivers of Site Performance
From a user’s perspective, a “page” is the URL in his or her browser. But, the reality is much more complicated. The browser makes dozens of behind-the-scenes calls when a single page loads. These include the following.
- Many parts to a web page. Multiple calls go to your web server to load the base HTML for the page, stylesheet(s) needed, JavaScript files used on your site, and each of the images used to build the page.
- Incorporating social media links. Calls go to each of the different social networks that you have integrated with your site to enable users to easily share content.
- Links to analytics platforms. Calls go to your web analytics platform to capture and record the page view itself.
- Links to ad servers. Calls go to ad servers if you are running digital media campaigns to record the results of your ads and to enable retargeting of ads.
To build a page, it is not uncommon for a browser to make one or more calls to 20 or more different “sites.” Depending on how the page is built, a glitch or delay in any of those sites can hold up the loading of the entire page. Furthermore, these glitches may be isolated to specific groups of visitors: those in a certain country or region or using a certain browser, for instance.
There are several different ways to track how quickly and reliably the pages on your site load. None of them are perfect, and none of them are bulletproof. The best strategy is to take a multi-pronged approach.
Know What Loads
While it’s not on-going measurement or monitoring, simply getting familiar with all of the different components that load on your site is a good place to start. The Firebug plugin for Firefox is a free way to get a visual display of what your browser is actually doing behind the scenes to render a page on your site.
Below is a screenshot from Firebug of an article on this site. In this case, there were 94 individual requests made by the browser to 12 different domains.
Firebug can break page loading down into individual components. Enlarge This Image
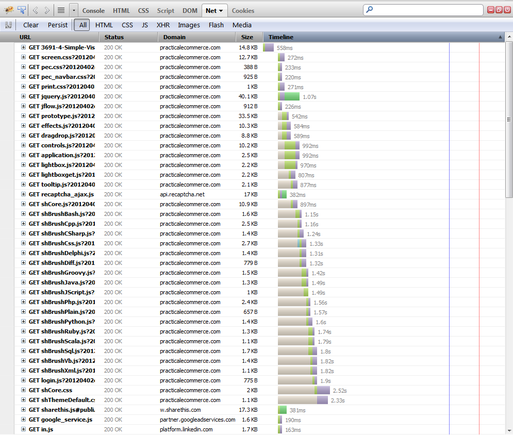
Scrolling through the Firebug screen shows:
- Each individual image, JavaScript file, and CSS file that loads;
- How long it takes from the initiation of the request by your browser to the asset being returned and loaded;
- The “Status” of each request — see a number of “304 Not Modified” entries when you load a page on your site, because you visit your site often and, therefore, have a number of assets cached by your browers. Hold down SHIFT and refresh the page, and you will not see any 304 codes, but, instead, “200 OK” codes. This is a closer approximation of how the page loads for first-time visitors to your site.
Keep in mind that this inspection is only one user — i.e., you — loading one page at one point in time from one geographic location. It is a good way to get an understanding of the individual elements of the pages on your site, as well as to uncover major errors with the site. But that’s where the value ends.
Google Analytics Site Speed Reporting
Google Analytics provides built-in “Site Speed” reports — at Content » Site Speed — that show a number of page load averages.
Google Analytics will chart both page responsiveness over time and on average.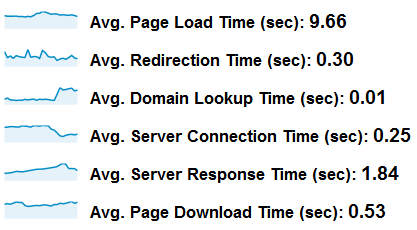
On the “Page Timings” report, click on the “Performance” tab to see a distribution of page load times across the site, as shown below.
Breaking load times into a histogram makes it easy to see typical behavior.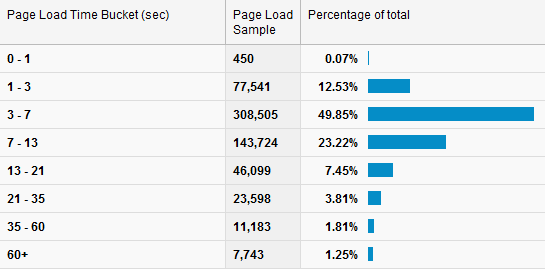
The “Explorer” tab on the “Page Timings” report shows the page load time for individual pages, as follows.
Google analytics can also show the behavior of individual pages.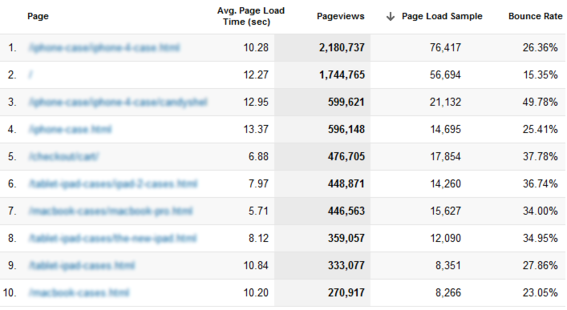
This is useful because it is based on data from a diverse and appropriate set of users: the actual visitors to your site.
However, there are some caveats to this data.
- Based on a sample of visitors. For pages that are important, but that get limited traffic, you may have data based on a very small number of actual visitors
- Relies on JavaScript. Data is only collected if the Google Analytics JavaScript for the page executes. If a page or set of pages has very slow load times, visitors may regularly abandon before that can happen. Thus no data gets collected for these sessions; but these are the exact sessions that you most care about from a load time perspective.
Any time the site gets updated with new functionality or a new design, these are useful reports to check to monitor overall page performance. And, consider setting up a custom alert in Google Analytics for “Avg. Page Load Time” to get notified if Google Analytics detects a sudden change in load time.
Third-Party Monitoring
The benefits of third party monitoring include:
- Consistent, repeatable measurement;
- Monitoring performance across a range of geographic locations — and reporting comparisons across them;
- Alerts that can notify you very quickly if there is a problem with the site.
These services can range in price from inexpensive to pricey, depending on the scope and frequency of the monitoring. There are many companies providing these types of services, ranging from those that have free and tiered offerings — such as SiteUptime, monitor.us, and Site24x7 — to extremely robust and sophisticated services like Gomez.
The spectrum of monitoring ranges from very basic to much more sophisticated, as follows.
- Basic site response. This is often called a “ping test” and is when the monitoring service sends a request to the site at some repeating frequency — such as every five minutes or once an hour —and looks for a “valid” response to come back. This is useful for ensuring that, at the most basic level, the site is up. The higher the frequency of the pings, the faster the system can alert you to a problem. And, the service can provide a “site uptime” report that tells you, for any period of time, how often — 99.0 percent, 99.5 percent, 99.9 percent — these ping tests were successful.
- Page load time. This is a level beyond a ping test, in that, for specific URLs you provide, the service measures how long it takes for all of the assets on the page to be returned and loaded. This is the external monitoring complement to the Google Analytics “Page Timing” report, with a different measurement approach.
- Page load time with content checks Some services go beyond simply measuring how long it takes for the content for a page to load to actually check that the right content is loading. This is useful for catching the rare, but catastrophic, situation where a key page returns a “graceful failure.” Earlier this year, for instance, a major fast food chain’s home page displayed, rather than delectable images of burgers and fries, the documentation for its content management system. A ping test to the site would have come back fine. And, the page loaded fine, but with completely inappropriate content.
Overwhelmed?
In this article, I have addressed a range of approaches for answering the simple question, “How fast does my site load?” Many ecommerce and content management platforms have internal application monitors that should be enabled and configured. Site hosting providers often have monitoring services to monitor server loads and response times. Third party link checkers and analytics tag checkers from services like Hub’Scan and ObservePoint can crawl your site proactively, looking for issues before too many humans stumble across them.
This may all seem overwhelming. But even basic and simple measurements of your site’s performance are much better than no measurement at all. In a perfect world, you would design a multi-faceted, comprehensive set of tools and services to proactively monitor all possible aspects of the site.
But simply being aware of what each tool you have in place is measuring with regards to your site’s uptime and page load time is a good place to start.


