You can explore the impact of social media on your site’s revenue using data that is already available to you. None of this data is perfect, and none of it is comprehensive. But when used together, the data can inform how and where you invest.
Organic vs. Campaign-Driven Social Media
There are two distinct ways that social media can impact your business.
- Organic impact. Depending on your target customers and the products you sell, consumers will talk about your brand and link to your site. Enabling social plugins — i.e., Facebook Like button, Twitter Tweet button, Google+ button — on your product pages can facilitate organic sharing. Users will also simply copy and paste URLs and link to your home page or your blog posts in their online conversations. These conversations can raise the awareness of your site, impact attitudes and perceptions of your brand, and sometimes directly drive click-throughs and conversions.
- Campaign-driven impact The other way social media can impact your business is through specific social media campaigns. These include offers that are promoted through your own social media properties, but also include social media advertising that promotes your site, your products, or specific offers.
Keep these two different aspects of social media in mind as you analyze social media as a traffic and revenue driver.
This article focuses primarily on the organic impact of social media. The campaign-driven impact should be managed like any other campaign that drives traffic to your site: Include tracking tags in each link you control, and assess the performance of each campaign using that data.
Social Media’s Organic Referral Traffic
The most directly measurable organic impact of social media is when an order can be traced back to a click-through from a social media site. These conversions occur on two levels.
- Last interaction conversion. A visitor clicks through on a link that is posted in social media and, while on your site during that visit, he or she places an order. In Google Analytics terms, this is a “Last Interaction Conversion.”
- Assisted conversion. A visitor clicks through on a link that is posted in social media and does not immediately place an order. At some point, however, the visitor returns to the site through some other means — such as a Google or Bing search, or by typing in the URL of the site — and then makes a purchase. In Google Analytics terms, this is an “Assisted Conversion.”
In both of these scenarios, social media had some impact on the visitor’s purchase. In many cases, though, other channels also influenced the visitor’s ultimate decision to visit the site and place an order. Focusing on precisely attributing which channel contributed what is a good way to develop a headache, and to spend hours with no actionable result.
However, assessing how much traffic and how many orders involved a social media click-through — as well as how these change over time as you proactively engage with social media — is a worthwhile exercise.
Google Analytics has a number of features and new reports that can help with this assessment. Start by looking at visits from social networks. Remember, if little traffic is coming from social media, then, by definition, there will be very few related conversions.
The “Traffic Sources » Social » Sources” report provides this data.
A simple listing of where your social traffic comes from is a good place to start.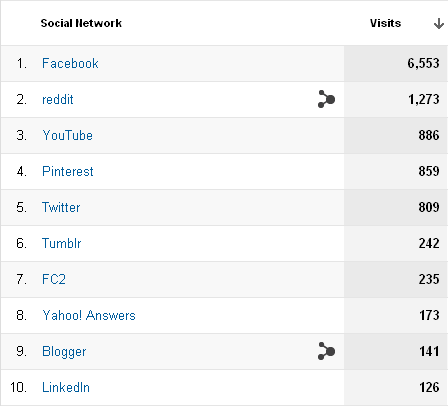
Use this report to identify links that are generating traffic. Consider visiting those social networks, searching for conversations about your brand and potentially assisting or engaging in the dialog.
Beyond simply evaluating traffic, you will want to assess how that traffic is converting to orders. One of the ways to do this is through the “Traffic Sources » Social » Conversions” report. Change the dropdown menu at the top of the screen to only include the “Ecommerce” conversions — although you can certainly explore your custom goals with this report as well.
You can filter your data to show only conversions.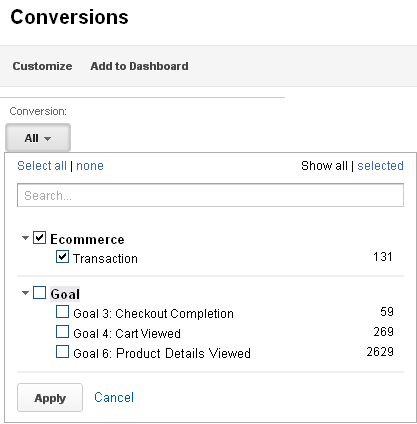
The report will list, by social network, the total conversions and revenue for which a visitor had, at some point, clicked through on a link on that network.
Compare your conversions against your raw traffic to see how your site is performing on different social networks.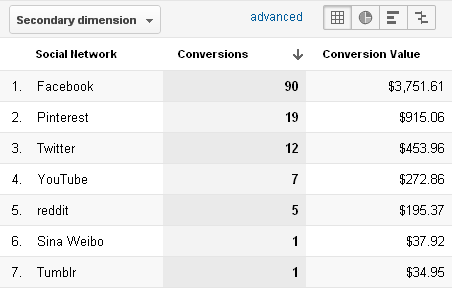
This view includes both assisted conversions and last interaction conversions. So you will want to split the results by clicking on the “Assisted vs. Last Interaction Analysis” view of the same report.
For deeper analysis, you can view consumers’ behavior immediately before converting.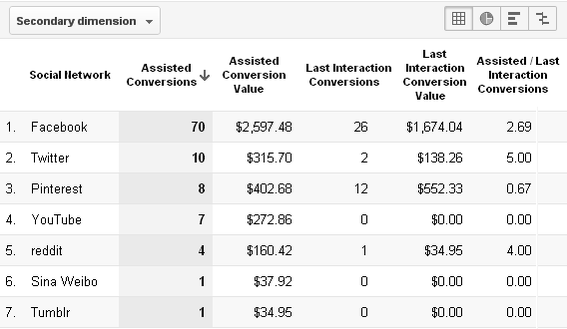
As an aside, don’t add the numbers and try to make them match with the base “Conversions” view. Because a single channel may be counted as both having assisted with a conversion and having been the last interaction, and because multiple social networks may be involved in a single transaction, the numbers will not generally add up. The more detailed you get with the reporting, the more cases of double-counting will occur. This is one example of why “attribution management” is such a complex topic.
To view the actual sequence of ways that visitors came to your site over time leading up to a purchase, go to the “Conversions » Multi-Channel Funnels » Top Conversion Paths” report, filtered by “Social Network.”
You can also view what paths consumers take to conversion.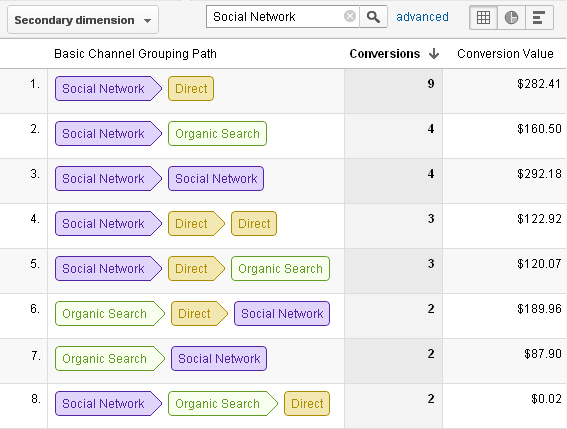
Notice that the number of conversions for each unique “path” is relatively low. This makes sense. People behave differently when it comes to researching purchases and, ultimately, buying a product. For that reason, it makes little sense to try to find the “most common path.” Rather, use this data to think through different real-world scenarios. Analyze the people who took these paths and how they, your site, and your brand’s presence in social media all came together for these distinct purchase journeys.
In the example above, it appears that many visitors first came to the site through a link on a social network. Of those visitors who ultimately purchased, they returned to the site through an organic search or by directly typing in the URL. This suggests that consumers are talking about the company’s products and linking to them in a way that introduces their friends to the brand. Site owners may consider fostering more of this behavior by ensuring that social plugins are easy to see and use on their sites, encouraging visitors to share product details or their recent purchases on Facebook, Twitter, and other social sites.
Beyond Referral Traffic: Just Ask
Analyzing how many people clicked through on social network-posted links to your site certainly provides useful information about the impact of social media on driving revenue. But this data tells an incomplete story. Almost certainly, some of your customers are influenced to purchase your products and services by social media even when they never click through on a social network-posted link.
The only way to capture and quantify how often social media influenced purchases in this non-click fashion is to ask visitors and customers. This approach is the cornerstone of the “Social Media Value Calculation” capability from Foresee, the analytics and survey firm.
Any mechanism in place for visitor feedback is an opportunity to ask if the visitors have seen references to your brand on social networks and, if so, if that influenced their decision to visit your site and make a purchase. Opportunities to ask these questions include:
- An online survey on your site;
- A feedback survey sent to customers post-purchase;
- A question or two in the scripts for your call center.
Summary
There simply is no easy, precise, inexpensive way to measure and analyze the impact of social media on driving revenue. But that doesn’t mean social media shouldn’t be analyzed. By combining the data you already have through Google Analytics reports with, perhaps, some adjustments to the way you already ask customers for their feedback, you can get a good sense of the degree to which social media is involved in your customers’ purchase journeys.