Ecommerce merchants strive to optimize their returns on investment from advertising. Google Analytics can help, with its integration to Google AdWords that allows ecommerce sites to view advertising spend, revenue, and ROI.
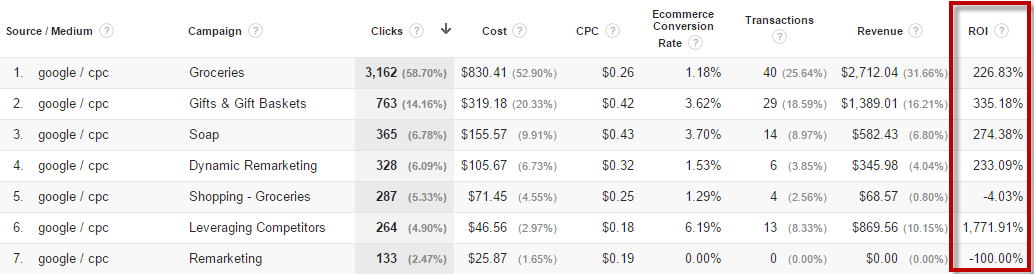
Google Analytics can integrate with Google AdWords to allow ecommerce sites to report various metrics. Click image to enlarge.
In addition to AdWords, many ecommerce merchants use Bing Ads, Facebook Ads, and other advertising channels. But measuring ROI from those channels can be challenging. And since those channels typically drive less traffic than AdWords, merchants often neglect optimizing them. And that’s the opportunity. If you can overcome these challenges, you are one step ahead of your competitors.
Google Analytics enables advertisers to import advertising cost data from most any channel. Access the Data Import configuration section in the Admin tab under the “Property” column.
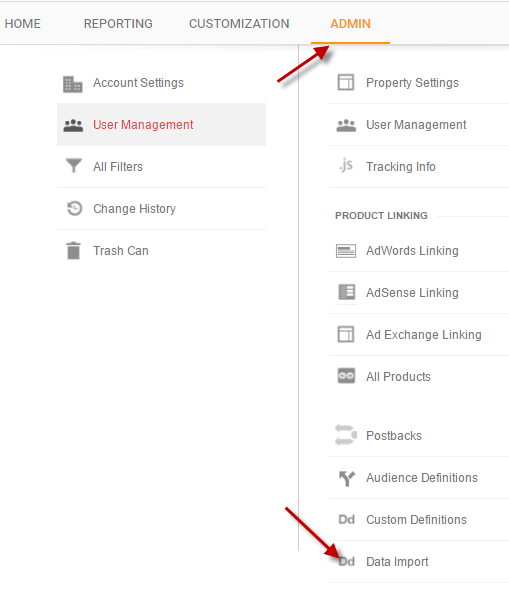
Access the Data Import configuration section in the Admin tab under the “Property” column.
Preparing the Import at Google Analytics
To set up your advertising cost data import, do the following.
• Create a “New Data Set” by logging into your Google Analytics account, then go to Admin > Data Import under the “Property” column (as shown above).
• Click on “New Data Set,” then select “Cost Data” and click on the “Next Step” button.
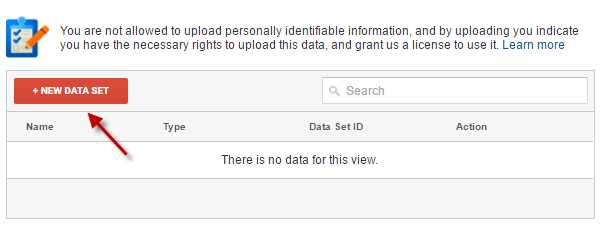
Click on “New Data Set.”
—
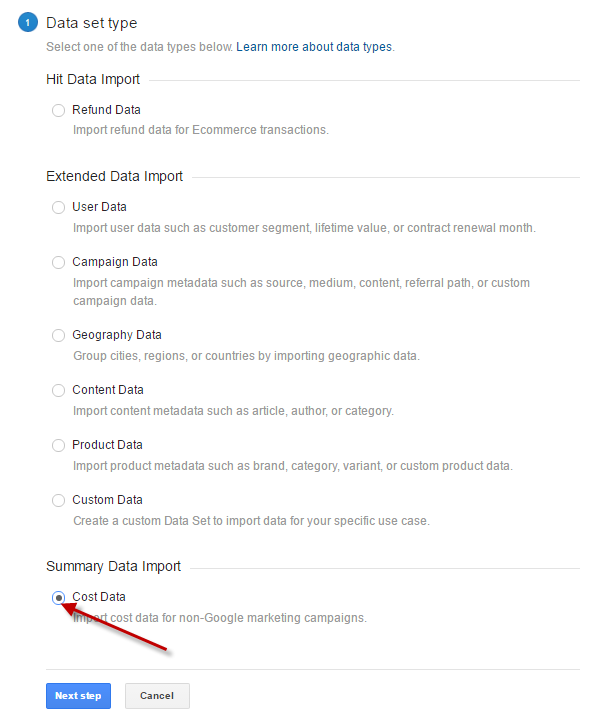
Select “Cost Data” and click on the “Next Step” button.
• Name your Data Set and select which Views you would like the cost data to appear. The name is not important as it will not show up in your reports and it doesn’t hurt to select all Views shown in this step.
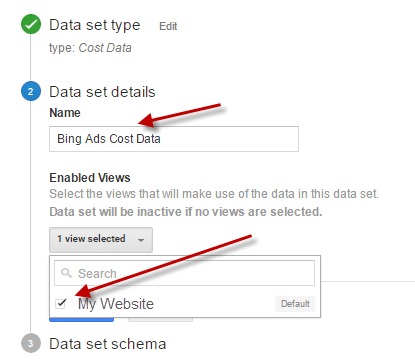
Name your data set and select which Views you would like the cost data to appear.
• Select all of the columns of data you plan on importing. I recommend, at a minimum, Impressions, Clicks, Cost, Campaign, Ad Content (not Ad Group, as UTM parameters will map to Ad Content), and Keyword. Consider including Search Query, too.
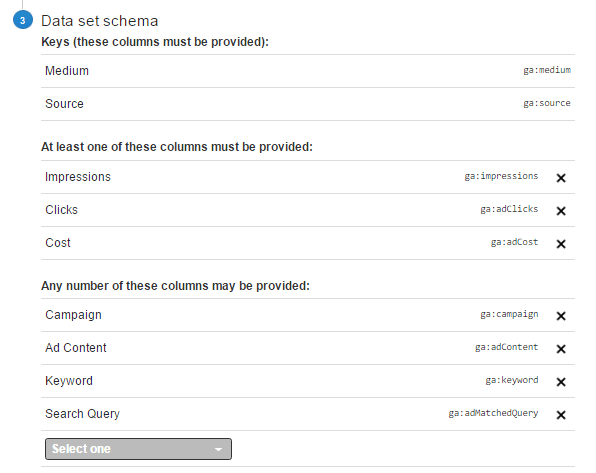
Select all of the columns of data you plan on importing.
• For the “Import Behavior” section, select “Overwrite.”
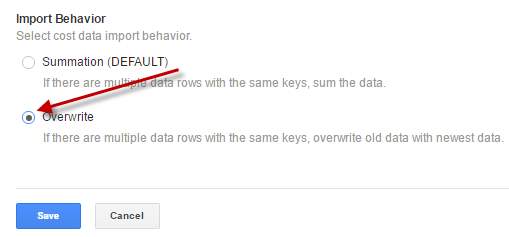
Select “Overwrite” in the “Import Behavior” section.
—
• Click “Save” and then click on “Get schema.”
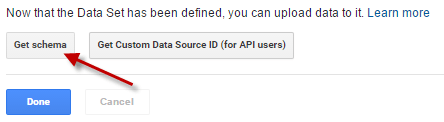
Click “Save” and “Get schema.”
—
• Click on “Download schema template” to obtain the file you will populate with Bing Ads cost data, to upload to Google Analytics. (I’ll use Bing as an example since Bing is the second most popular advertising platform for ecommerce marketers.)
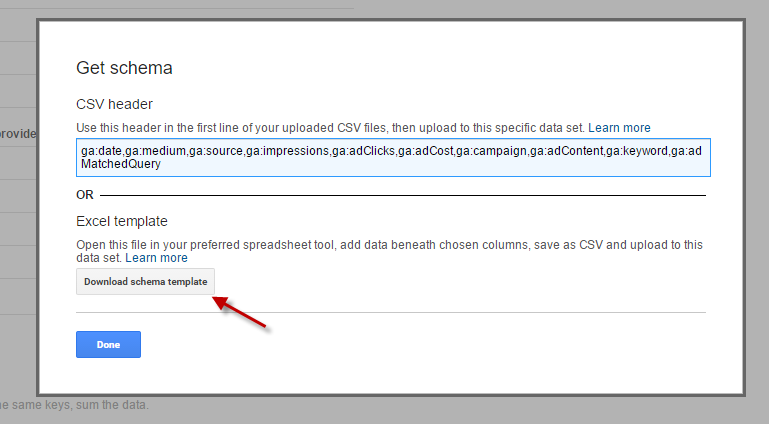
Click on “Download schema template.”
—
• Save that file to your computer. You are now ready to start importing cost data.
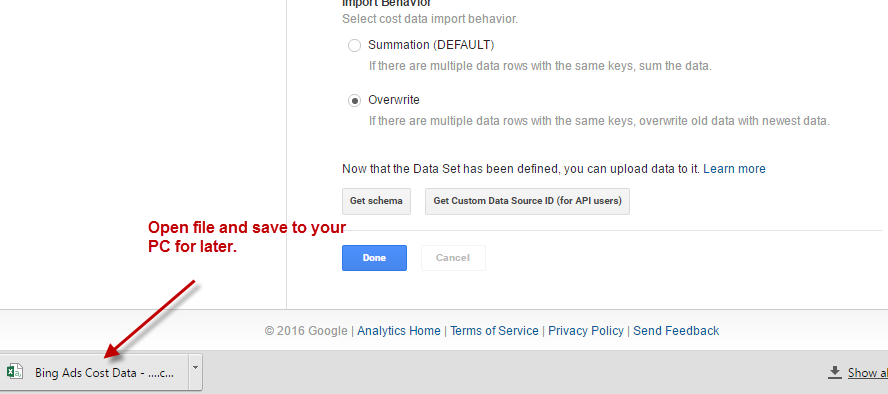
Download the file to your computer.
Obtaining Cost Data from Bing
Now for the fun part: getting the cost data from your advertising channel — Bing, in this example — and assembling it the way Google wants it, and importing.
• Log into your Bing Ads account and go to the “Reports” section.

Log into Bing Ads and go to “Reports.”
If you want to include the Search Query in the report, run a “Search term” report for the relevant time frame. If you want to report at the Keyword level, select “Keyword“ report.
I will run a “Keyword report” for this example.
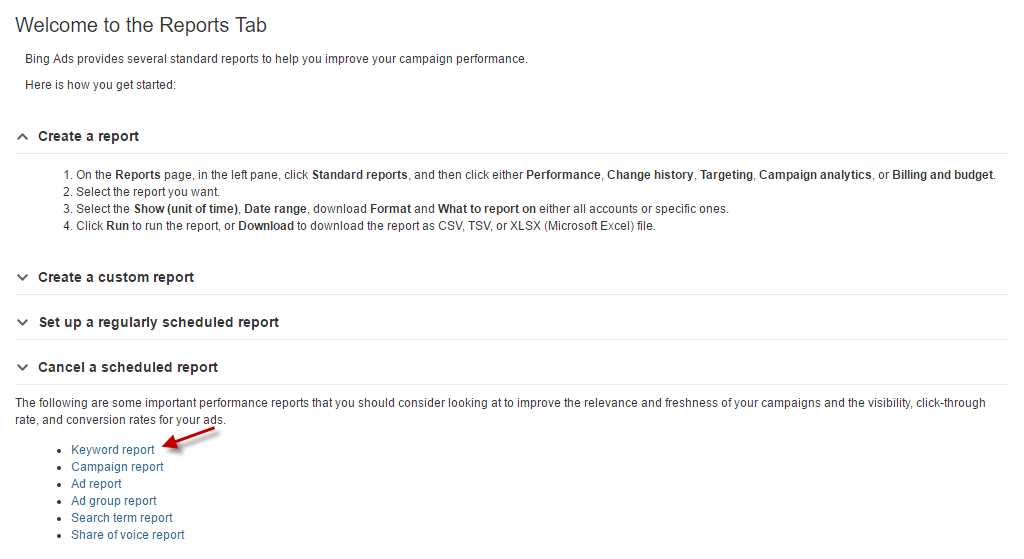
Run a “Keyword Report.”
• Update the “Show [unit of time]” to “Day” to import cost data on a daily level. Adjust the date range as needed and select the correct time zone for the account.
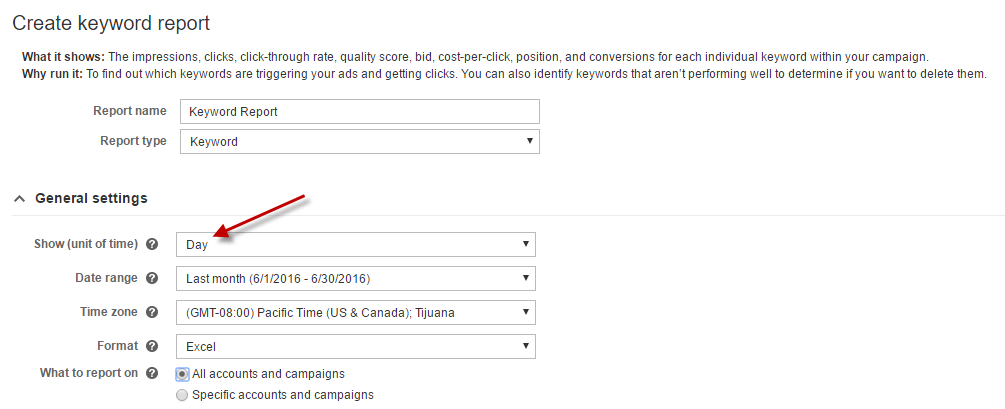
Update the “Show (unit of time)” to “Day.”
• Under “Choose your columns,” select the following: Date, Campaign, Ad group, Keyword, Impressions, Clicks, and Spend.
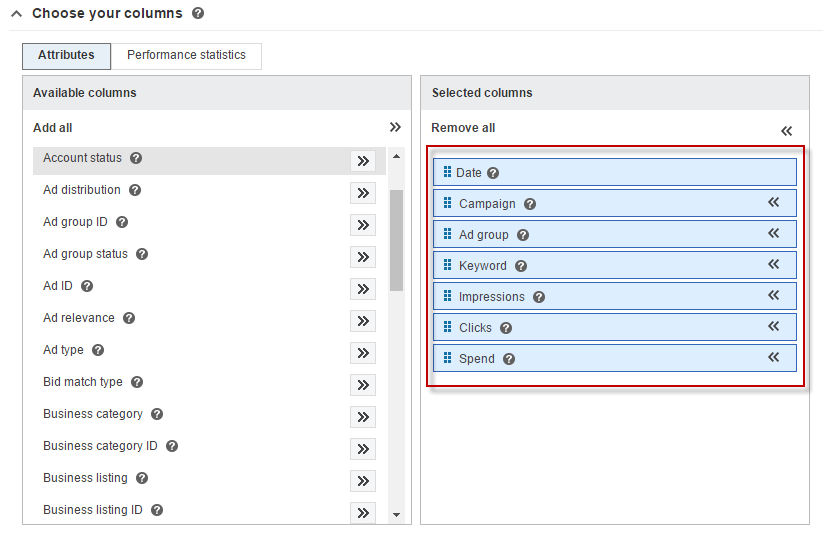
Select the Date, Campaign, Ad group, Keyword, Impressions, Clicks, and Spend columns.
• There is no need to adjust anything in the “Filter” section or “My report settings” section. Click “Download” and the report will run and download
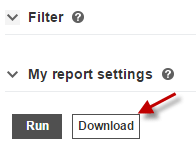
Click “Download.”
• Once the report has run, it will download the file to your computer. Click on the downloaded report link in the bottom-left of your screen so it opens.
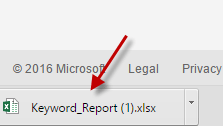
One the report is finished, download it to your computer.
• Now, copy all of the data into the schema template that you saved to your computer, as described above for setting up Google Analytics for the data import.
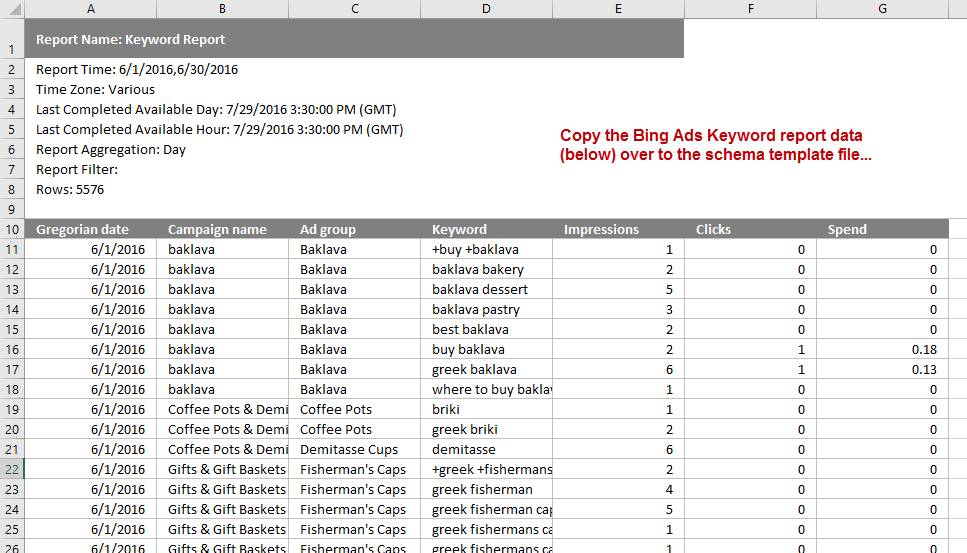
Copy all of the data into the schema template that you saved to your computer in the instructions for setting up Google Analytics. Click image to enlarge.
Make sure you assemble the data in the schema template so that the column headings align. Here’s a mapping of the Bing Ads report columns to Google Analytics cost data schema template headings.
- Gregorian date > ga:date
- Campaign name > ga:campaign
- Ad group > ga:adContent
- Keyword > ga:keyword
- Impressions > ga:impressions
- Clicks > ga:adClicks
- Cost > ga:adCost
Your data will look like this when entered in the schema template.
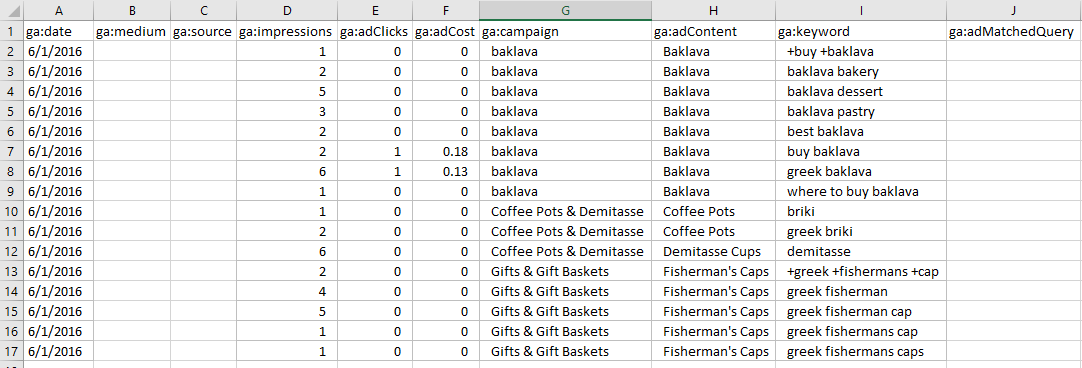
Sample Bing Ads cost data when entered in the Google Analytics schema template. Click image to enlarge.
• Update the “ga:date” column to use the correctly formatted date with the “yyyymmdd” format. Set the ga:medium and ga:source columns to whatever you are using for the medium and source in your UTM parameters for Bing Ads. If you enabled auto tagging in Bing Ads, it should be “cpc” as the Medium and “bing” as the Source.
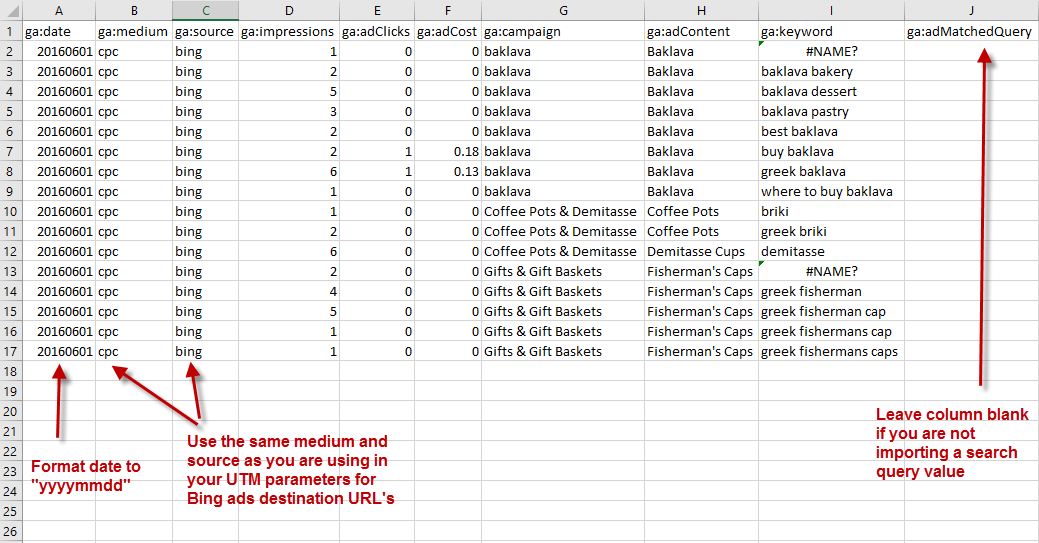
Update the “ga:date” column to use the correctly formatted date with the “yyyymmdd” format. Set the ga:medium and ga:source columns to whatever you are using for the medium and source in your UTM parameters for Bing Ads. Click image to enlarge.
• Save the file using a name that makes sense to you. I typically include the date range in the file name, such as “Bing Ads Cost Data – June 2016.” Save as a .csv (UTF-8 encoded).
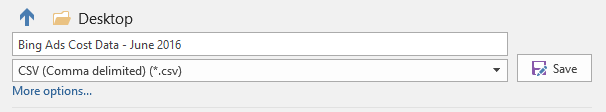
Save the file with a name that makes sense to you.
• You are now ready to import this file into Google Analytics. Go back to Google Analytics and click on “Manage uploads” next to the data set you created.
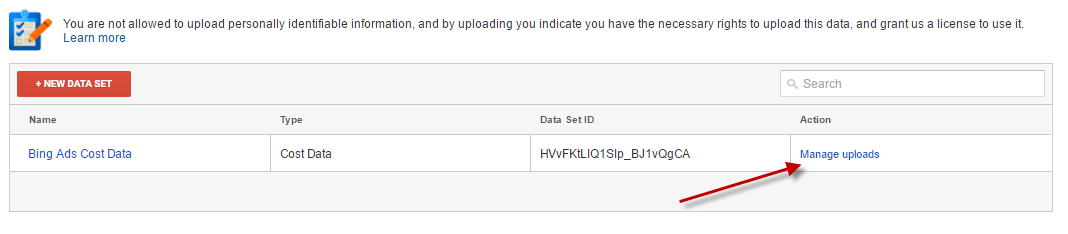
Go back to Google Analytics and click on “Manage uploads.”
• Click on “Upload File,” then “Choose Files.”
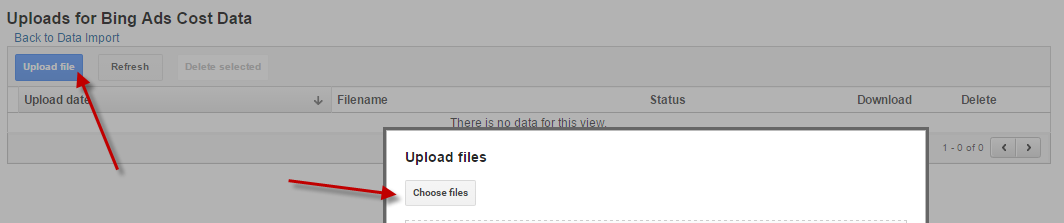
Click on “Upload File”, then “Choose Files.”
• Find your .csv file, select it, and then click “Upload.”
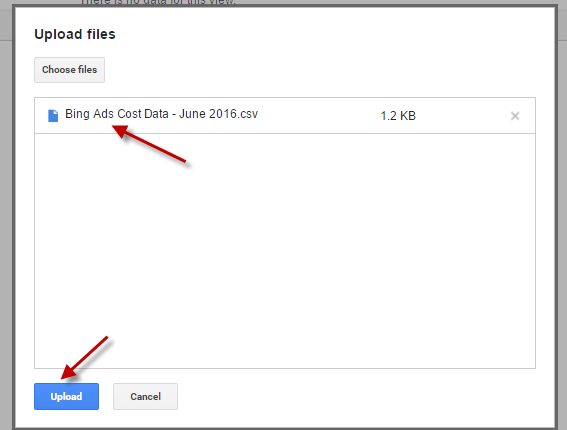
Select your .csv file and upload it.
If the upload was successful, you will see “Completed” in the Status column. You have now successfully uploaded Bing Ads cost data to Google Analytics.
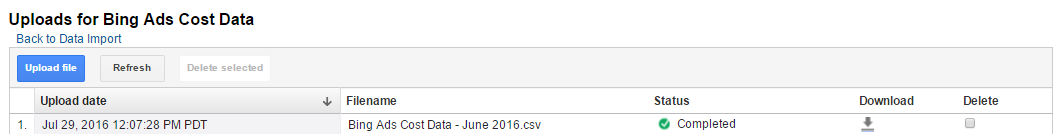
You will see “Completed” in the Status column if the upload was successful.
Locating Imported Cost Data in Google Analytics
Locate the imported cost data in Google Analytics at Acquisition > Campaigns > Cost Analysis.
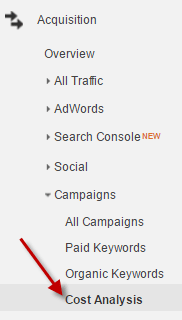
Locate imported cost data at Acquisition > Campaigns > Cost Analysis.
Sorting by “Impressions” in decreasing order, you should see all imported cost data at the top of the report.
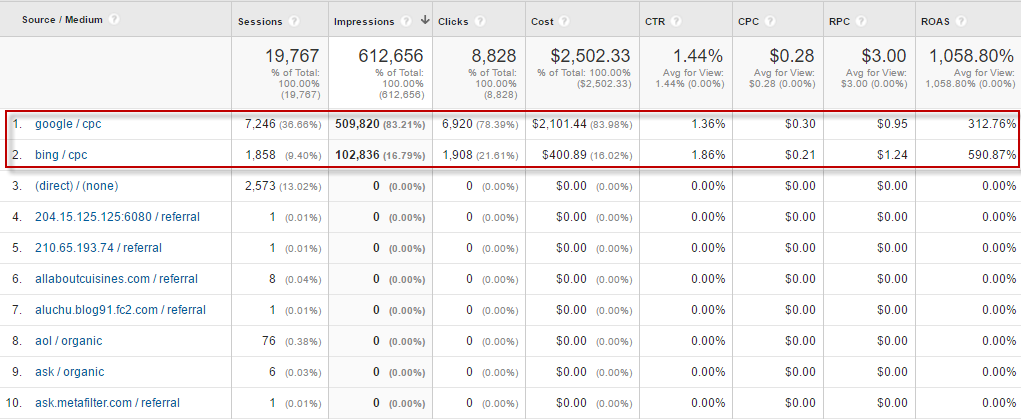
Sort by “Impressions” to see all imported cost data at the top of the report. Click image to enlarge.
Analyzing Imported Cost Data
Now it’s time to dig in. First of all, you can quickly see, at a high level, which channel is outperforming the others. In the above example, Bing Ads has a return on ad spend (ROAS) that is nearly double Google AdWords — 590.87 percent vs. 312.76 percent. This gives a quick visibility into where to improve (Google) and where to try to drive additional value (Bing).
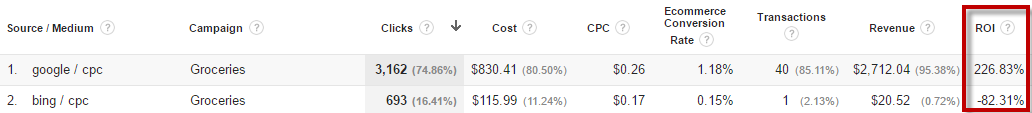
If you structured your campaign names to be identical between Google AdWords and Bing Ads, you can add a secondary dimension by Campaign and filter to include one campaign. I’ll do this, below, with a “Groceries” campaign for Google and Bing.
You can quickly see at a high level which channel is outperforming the other. Click image to enlarge.
I can now compare the same campaign across the two channels to see which is performing better. In the above example, Bing is underperforming Google — -82.31 percent vs. 226.83 percent. So I would consider optimizing Bing. I may also want to increase cost-per-clicks in Google to try to drive additional traffic.
In the example, below, I’m comparing the “Shopping – Groceries” campaigns between Google and Bing. In this case, Bing is performing better — 206.91 percent vs. -4.03 percent. I would optimize Google. I may also increase my CPCs in Bing to drive additional traffic.
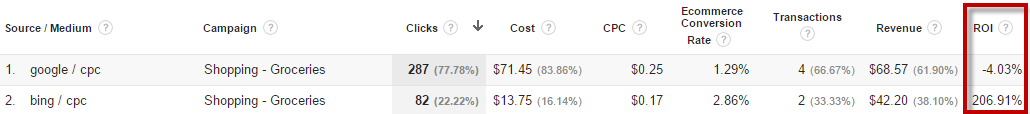
Comparing the “Shopping – Groceries” campaigns between Google and Bing. Click image to enlarge.
You can drill down to the Ad Group level or even Keyword level to identify which channel is performing better and which Ad Groups and Keywords need to be optimized.
Remember if you make significant changes in your advertising accounts, use Annotations in Google Analytics to mark time. (I addressed Annotations in “Using Google Analytics to Identify Conversion Weaknesses.”) That way you can measure the impact from those changes.
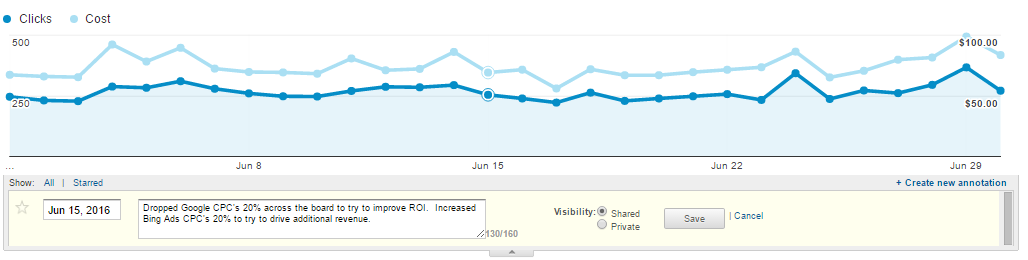
Use Annotations in Google Analytics if you make significant changes. Click image to enlarge.
Finally, turn this exercise into a process.
- Import cost data regularly. If the manual method of importing cost data is cumbersome, look for automated solutions. Several vendors are in the Google Analytics Apps gallery.
- Identify your target ROI or ROAS for advertising. Set different levels for different Campaigns and Ad Groups, if necessary.
- Monitor status regularly and take action if you are not meeting ROI goals — or if you are over-exceeding them.
In short, as an ecommerce merchant, it’s critical to measure how your advertising money is performing. Increase those channels that deliver the highest return on investment, and decrease or improve low performers.