
Google Analytics is finally jumping into mobile data metrics. Google recently launched “Mobile App Analytics” as a part of its Analytics web app suite. Analytics is already used by almost a fourth of Internet Retailer’s Top 500 online retailers and more than half of its “Second 500.” With Mobile App Analytics, businesses can now measure the amount of mobile involvement their websites see from daily use, special campaigns, in-app traffic, and specific mobile platforms.
With the growing popularity of mobile devices like tablets and smartphones, it’s increasingly important for businesses to be “mobile-ready.” As your potential customers migrate from personal computers to tablets and other devices, they will begin to interact with your website differently. They will expect different levels of accessibility and functionality that complement newer technologies.
With Google Analytics’ new features and mobile-friendly design, you can not only make your website more accessible to these new devices, but also track users’ behavior and dig up new, highly actionable data every step of the way.
The Basics: Finding Your Mobile Visitors
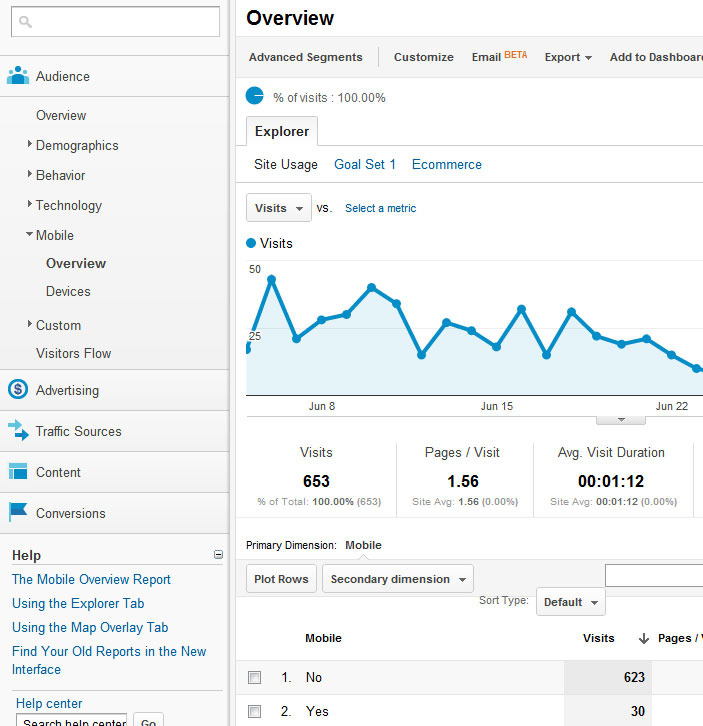
Mobile Analytics tracking adds a new submenu to your Google Analytics dashboard. “Mobile” can be found on the left-hand menu bar, under “Technology.” Opening this submenu gives you two options: Overview and Devices.
Mobile Analytics are accessed in the same manner as other analytics options. Enlarge This Image
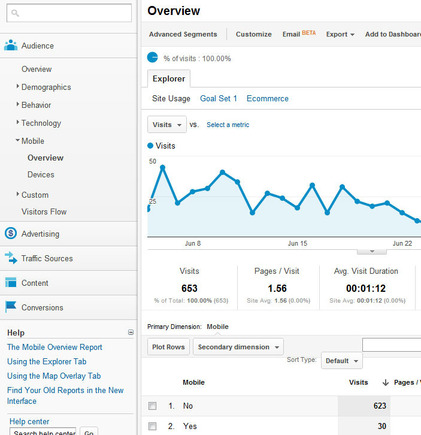
From there, notice that your dashboard looks more or less identical to your main Audience Overview — because it actually is the same. Mobile Overview gives you a look at your total traffic with two options below the graph under Mobile: “Yes” and “No.” This is a simple metric that determines whether or not a visitor is on a non-PC device when they access your web page.
To plot either or both metrics on your overview, tick the checkmark boxes next to Yes and No, then select “Plot Rows” above. Your data graph will change to reflect mobile users versus traditional computer users, giving you a visual reference for how mobile affects your company’s web traffic. You can also explore data using Custom Reports and Goals you’ve established for typical traffic: Mobile traffic can be tracked just as thoroughly as any other traffic source.
Powerful Data: Locating Your Mobile Visitors and Their Devices
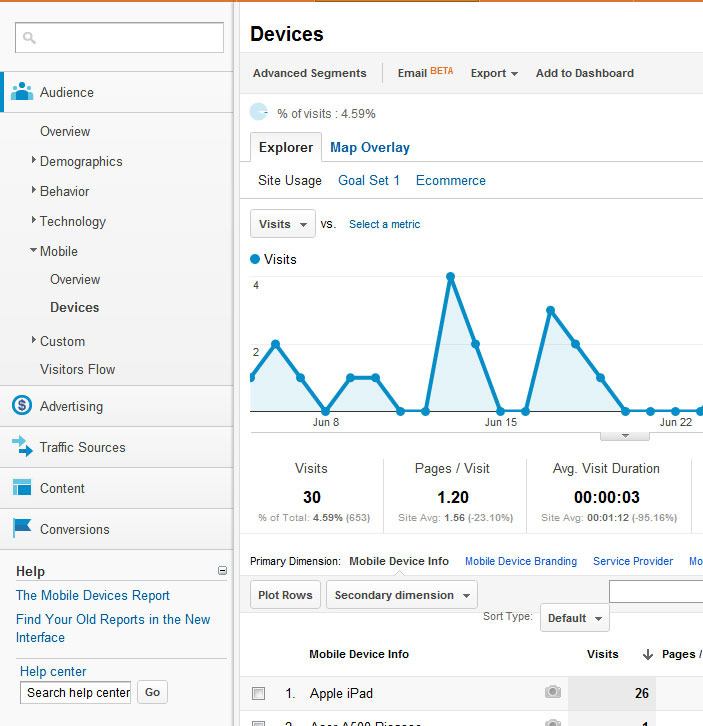
The Devices tab is where the power of Google Analytics really shines with its new Mobile metrics. The Devices dashboard will show you only your mobile visitors. Under the overall traffic graph, you can break these numbers down to see where these mobile visitors came from. Are they visiting your business’s site from their iPads? Their cellphones?
The Devices tab breaks down browsing behavior by type of mobile device. Enlarge This Image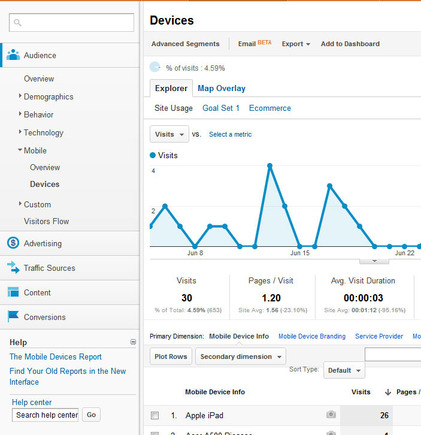
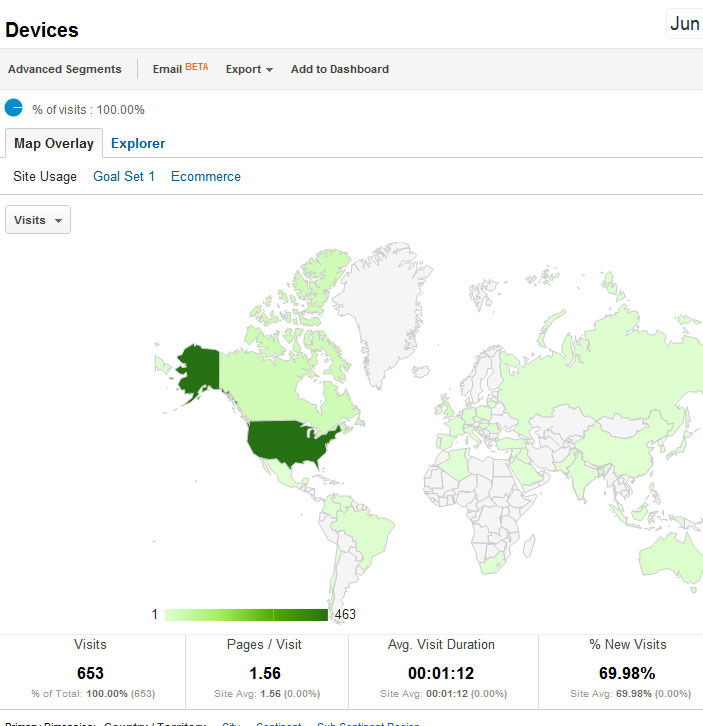
Better yet, you can see your mobile visitors on a world map, showing you exactly where most of your traffic is coming from based on physical location. Showing your mobile engagement on a map can show you exactly where people interact with your business’s marketing efforts the most, and where special campaigns and promotion efforts have the most regional impact. To find your mobile visitor map, go to the Devices dashboard under Mobile, then above the graph, select the “Map Overlay” option. Maps can be explored down to regional and city levels in your data explorer dashboard by selecting “City” or “Region” as your Primary Dimension under the map.
The Map Overlay breaks down traffic by geographic location. Enlarge This Image
App Tracking: Embed Google Analytics into Your Apps for New Insights on User Behavior
Google Analytics also features In-App usage tracking that can be fully explored through Google Analytics. This is more technical and is best suited for companies that have incorporated app development into their marketing strategies or their business plan. Developers and app managers can download the Analytics SDK from Google for either Android or iOS platforms, then deploy it within the code structure of their apps for the best results.
Once implemented, usage data can be explored in Google Analytics just like your business’s app was a website. This is an incredibly valuable new feature, seeing how apps have quickly become the go-to source for consumer engagement and interaction. For example, look at this infographic to see just how important apps are to smartphone users. App analytics can give developers instant feedback on how users actually interact with their app, which conversion opportunities are most successful, and how best to improve the app in future iterations.
Monitor Your Traffic Wherever You Are: Google Analytics for Android
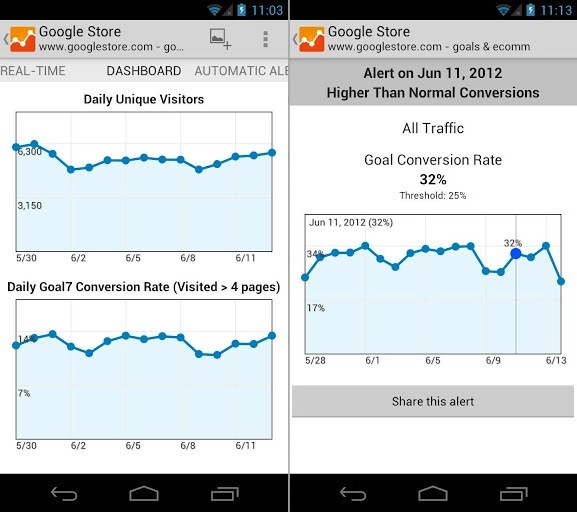
To complement this new suite of mobile-centered metric tracking, it makes sense that Google would finally release an Analytics app for its Android platform. With the Google Analytics app, you can log in and view real-time site metrics from your smartphone and check up on the progress made towards site goals and special reports. You can also set your phone up to receive automatic alerts and notifications based on website traffic in real time, so you’ll know when you can capitalize on high-traffic opportunities.
The Android app lets you view real-time traffic and custom alerts. Enlarge This Image
Summary
Mobile-ready websites are fully prepared to not only cater specifically to special mobile devices with unique styles and designs, but are also fully capable of monitoring their mobile metrics through Google Analytics. These new features will let you visualize new conversion paths for mobile users on your website or in your app, which can help you open valuable new revenue streams for your business.


