In May 2016, Google Analytics launched new reports for analyzing organic search traffic. Now you can view search engine data and Google Analytics data side-by-side, in the same report, to gain deeper insights into how well organic search traffic (from Google Search) performs on your site.
Google Analytics provides four reports related to search traffic: Landing Pages, Countries, Devices (mobile, desktop, and tablet), and Queries. All four reports include impressions (on search result pages), clicks, click-through rate, and average position.
To view these new reports, link your Search Console (formerly Google Webmaster Tools) property to your Google Analytics property — see instructions.
Locating Search Console Reports
- Log in to Google Analytics.
- In the top menu, select the Reporting tab.
- In the left side menu, expand Acquisition > Search Console.
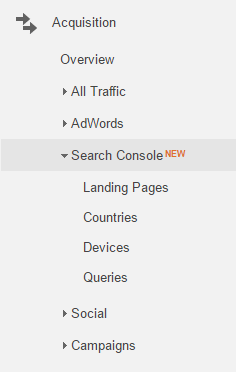
In Google Analytics, select the Reporting tab, then expand Acquisition followed by Search Console.
4 New Reports
Landing Pages. The landing pages report shows the top pages from Google’s organic search listings — with impressions, clicks, click-through rate, and average position — on the left side. On the right side are Google Analytics metrics — sessions, bounce rate, pages per session, goals, and transactions.
This report would identify, for example, landing pages that rank high and attract visitors organically, but have a high bounce rate. In that case, consider optimizing those landing pages for better engagement or conversion.
You could also view landing pages that have a low bounce rate and high conversion rate, but do not rank well. In this case, consider improving your search optimization on these pages.
You can drill down into each landing page to view data by search query.
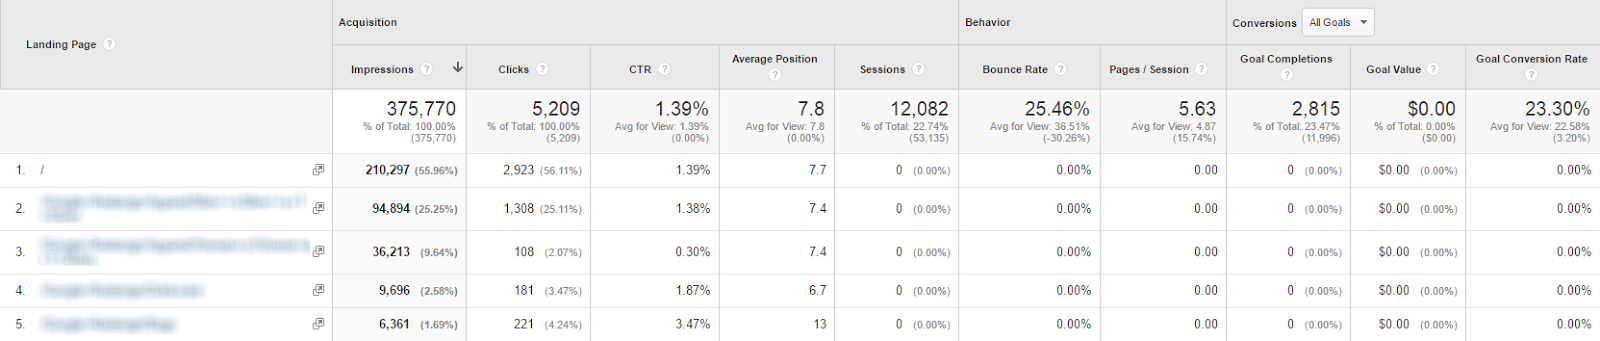
In the new Search Console reports, Google Analytics users can view popular landing pages by search query. Click image to enlarge.
Countries. This report will allow you to compare organic traffic from Google search by country. See which countries generated the most impressions and clicks, and which generated the most transactions and goals.
Use this report to determine, for example, how well international visitors convert through organic search. Drill down on each country in this report for a list leading landing-pages data from visitors in that country.
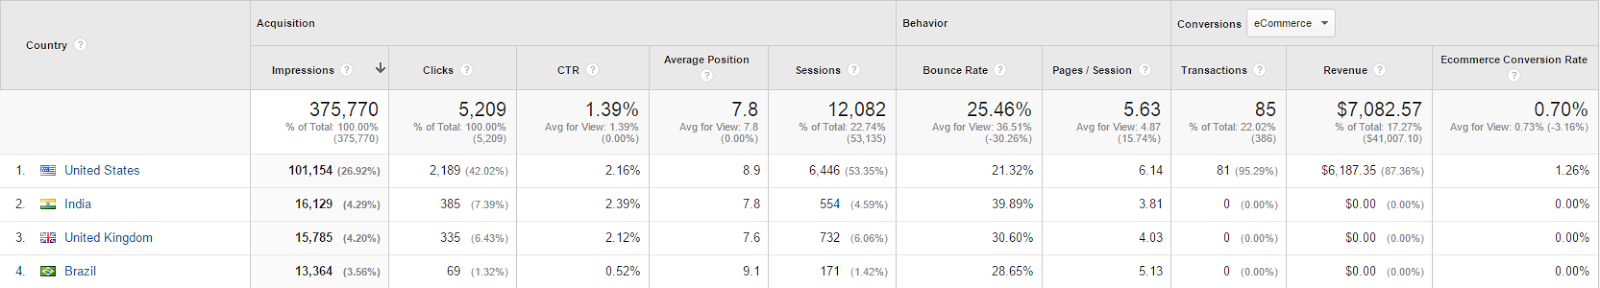
Click on a country to see the landing-pages data from visitors in that country. Click image to enlarge.
Devices. This is my favorite report. You can view the number of impressions, clicks, click-through rate, and average position by devices (desktop, mobile, tablet) alongside the number of ecommerce transactions and revenue for that device. If enabled, you can switch the “Ecommerce” menu to “Goals” (in the Conversions on the left side menu) to compare organic search metrics to your internal goals.
For many ecommerce sites, roughly 50 percent of traffic now comes from mobile devices. Is your SEO strategy working on mobile? This report will show you. You can also add another dimension to this report.
Use this report to see if your landing pages perform better on desktop or mobile. If your traffic converts better on desktop, consider a deeper analysis of your mobile traffic to find areas to improve.
You can drill down into each device type (desktop, mobile, tablet) to view landing-page data for that device.
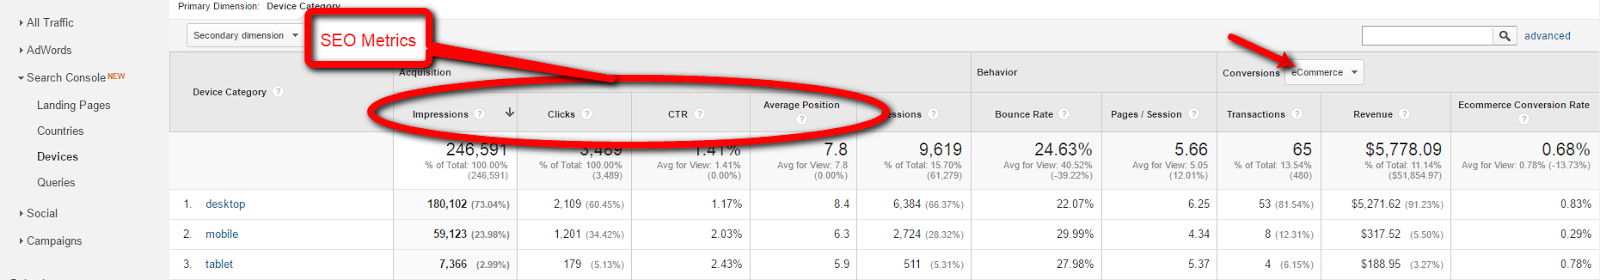
Click the device name to view the landing-page data for that device. Click image to enlarge.
Queries. This report provides insights for some of the keywords that drove organic traffic to your site. For each reported keyword, the report shows clicks, impressions, click-through rate, and average position. Use this report to see which keywords drove the most impressions and clicks to your site.
One metric to watch over time is the average position. If your average position improves, your site will likely gain more impressions and clicks. If the average position drops, try to determine why.
You can also use this report in conjunction with AdWords campaigns. If you are targeting keywords in AdWords that already rank high in organic search, consider pausing those campaigns to see if your traffic maintains its level. If so, you may be spending too much on traffic that would occur organically. This could free you to allocate those funds to other keywords.
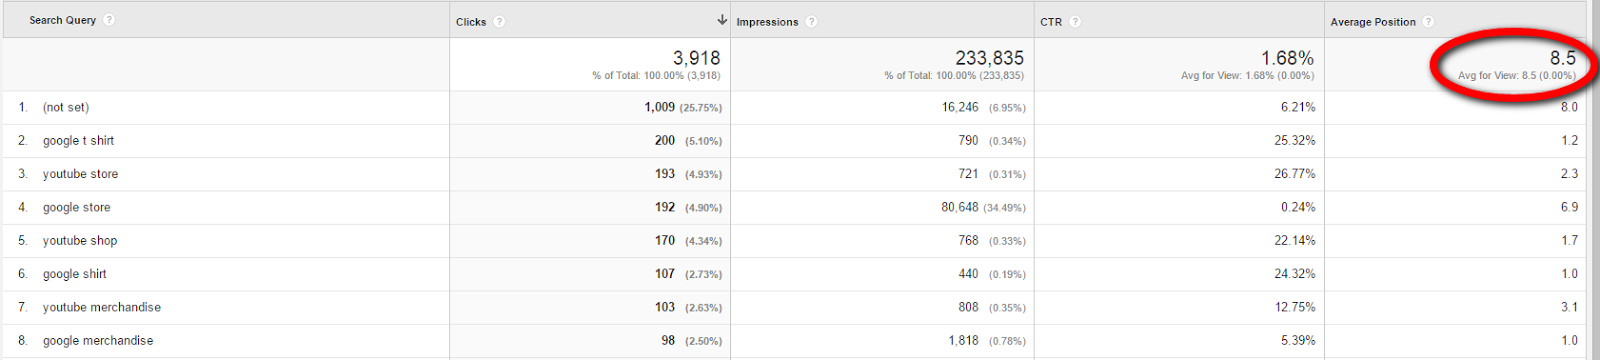
The Queries report provides insights for some of the keywords that drove organic traffic to your site. Click image to enlarge.
Sessions vs. Clicks
For each of the reports, the number of clicks and the number of sessions may be different. There are two likely reasons why this could occur. First, you could have custom filters set in Google Analytics that result in lower sessions. Also, you may have enabled bot filtering, which also lowers sessions, but not clicks.
Segments and APIs
You cannot segment the data in these reports. If you do, the segments will only be applied to your Google Analytics data and your search data will show as zeros. The impressions, clicks, click-through rate, and average position are not available in custom reports. In addition, this data is not available from the Google Analytics Reporting API. And the new reports are not available in the Google Analytics mobile app.
Keep SEO Data Longer Than 90 Days
Google retains your organic search data for only 90 days. If you need historical comparisons over a longer period, export that data, to save. To help, set up scheduled emails to export these reports each month. Do this using the “Email” tab at the top of each report page. You can, additionally, configure one email to attach all four reports, by selecting “Add to an existing email” at the lower right of the Email tab page.
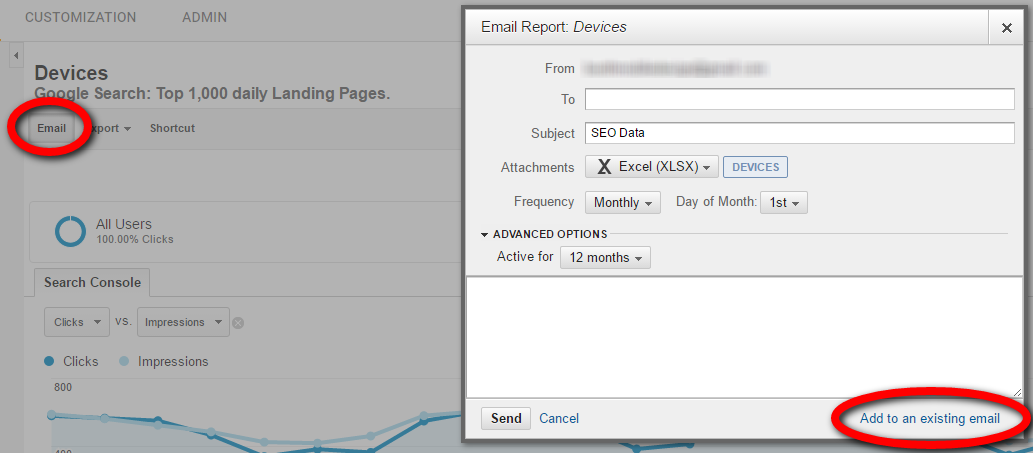
Set up scheduled emails to export reports regularly, such as each month. Do this using the “Email” tab at the top of each report page. To attach all four reports in a single email, select “Add to an existing email” at the lower right. Click image to enlarge.