
Facebook just launched a new version of Insights, its analytics engine.
One new addition is comparative, scorecard-style reports that enable businesses to evaluate positive and negative metrics together. Also, some elements in Insights have been renamed and the overall structure has been reorganized to make information clearer and easier to understand in terms of what’s working and what is not.
Here is a rundown of the overall changes and what they mean for merchants.
People Talking About This (PTAT) and Virality
One of the areas addressed was the PTAT metric, which is a measurement of the number of unique users who have created a “story” about a Page within a 7-day period. “Story” is Facebook’s term for actions such as post likes, comments, shares, and check-ins.
Facebook apparently received many inquiries from Page administrators asking for greater clarification on the exact types of actions that make up PTAT. In response, Facebook revisited the metric and, instead of an aggregate number, now provides reports on the following individual elements:
- Page likes;
- People engaged — the number of unique people who have clicked on, liked, commented on, or shared posts;
- Page tags and mentions;
- Page check-ins;
- And other interactions on a Page.
Virality, a measurement used to benchmark the quality of Page posts, has been renamed “Engagement Rate.”
Overview
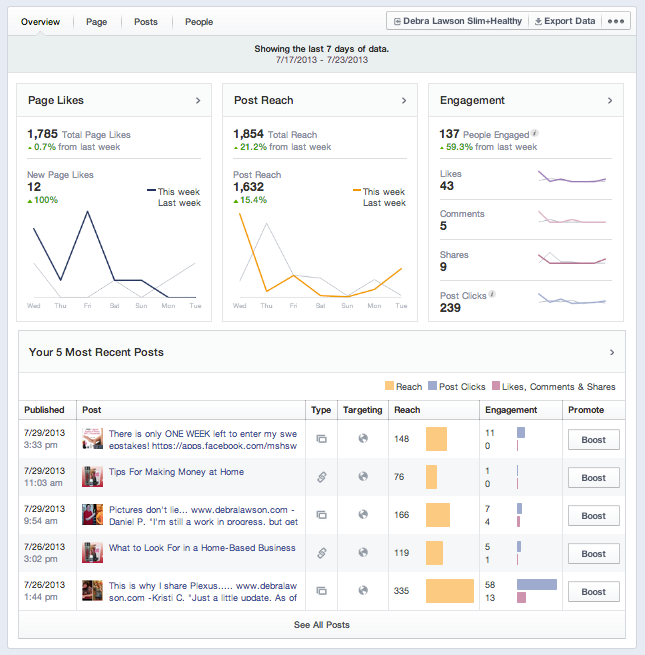
Important Page activity is showcased on the Overview. Enlarge This Image
The overview section presents a 7-day snapshot of the most important activity on a Page including likes, reach, and engagement, along with a list of the five most recent posts.
Page Likes
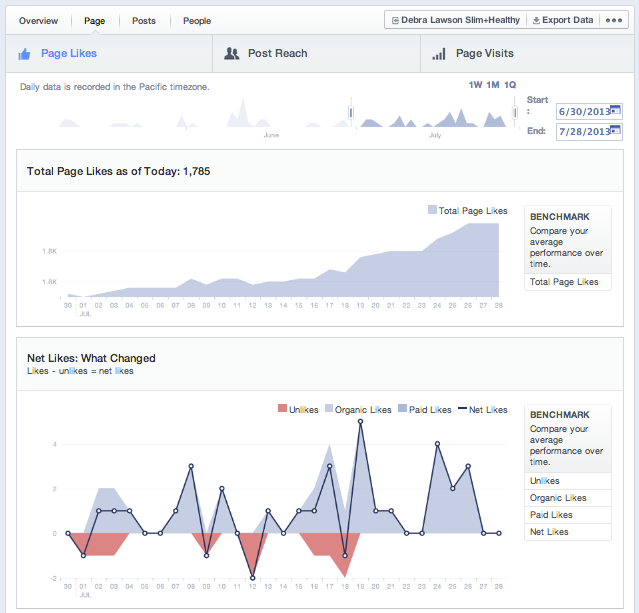
The section shows the number of likes and unlikes. Enlarge This Image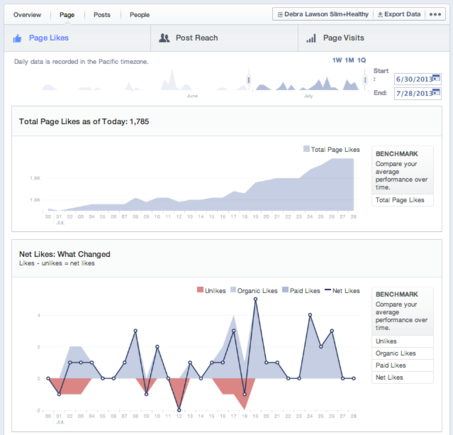
This report shows how many times a Page was liked and unliked each day — a metric Facebook calls “Net Likes” — as well as where people clicked “Like” from around Facebook to connect to a Page.
Post Reach
Post Reach helps admins improve content quality. Enlarge This Image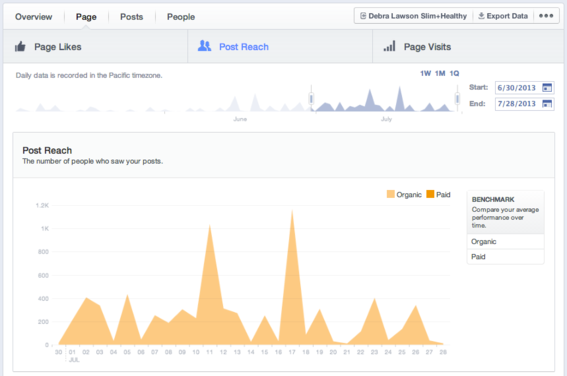
This metric reveals the number of people who saw Page posts, and helps administrators compare reach with posting activity on a given day. Admins can look at posts to determine factors that contribute to a spike or dip in reach.
Facebook’s News Feed rewards higher quality posts with greater reach, so more people who will see it.
One of the ways Facebook’s algorithm gauges post quality is through the relationship between positive interactions (likes, comments and shares) and negative interactions (hiding a post, reporting a post as spam, or unliking a page). Using this report, administrators can review posts that receive more positive interactions and create more of that type.
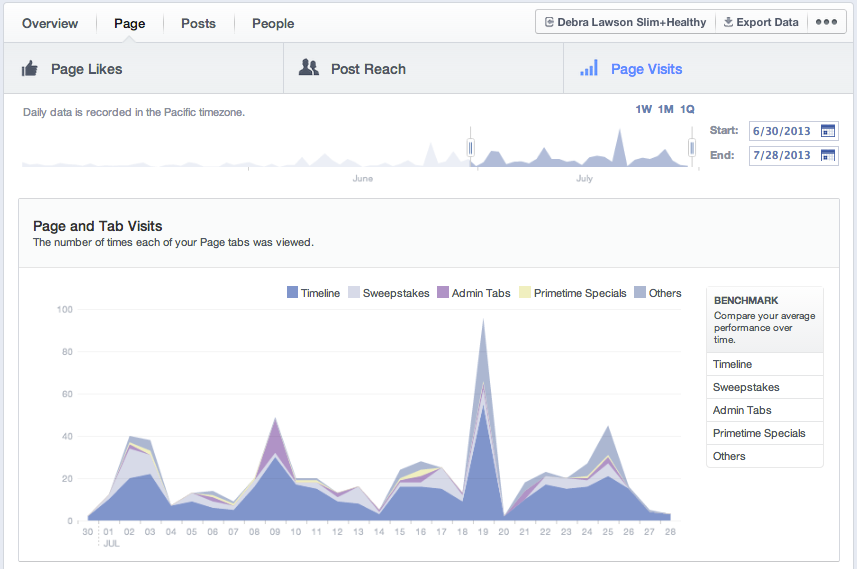
Page Visits
Page Visits is useful for planning future campaigns. Enlarge This Image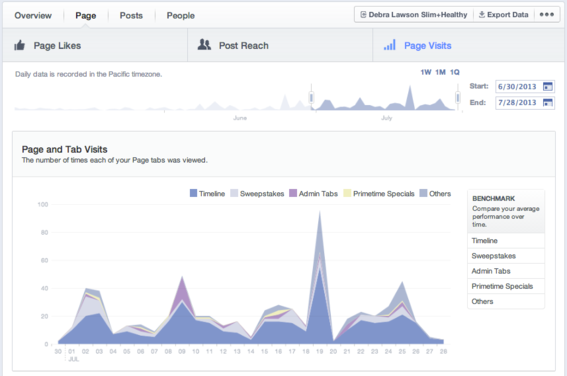
This shows how many times each Page tab was visited. Admins can compare performance over a period of time to see which tabs receive the most activity — information that can come in handy when planning future campaigns or promotions.
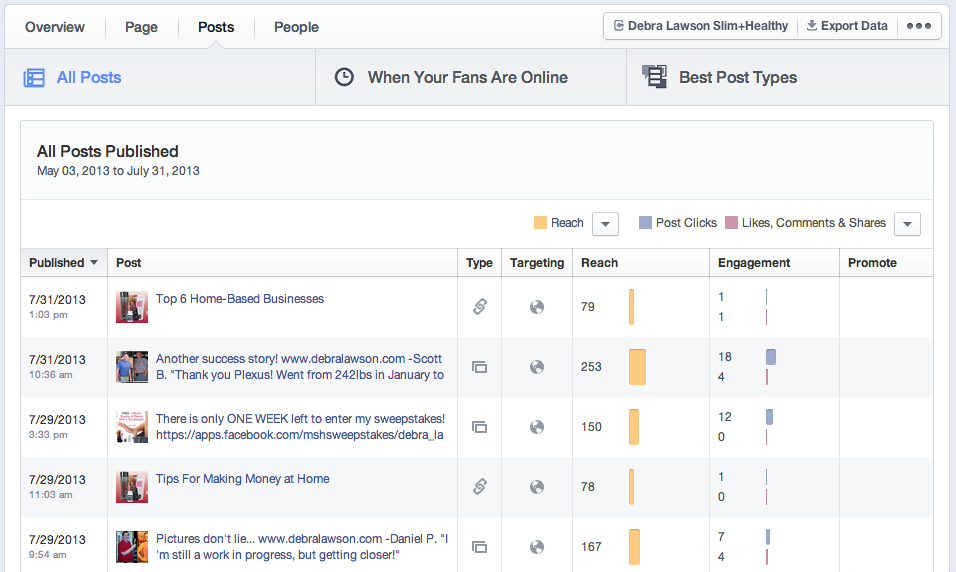
Page Posts
In this report admins see the best and worst performing posts. Enlarge This Image
Understanding how people respond to posts is a critical part of creating the best content for a Page. Facebook has consolidated all post-related activity in one location so admins can see the best and worst performing posts, which will provide insight into what works, and what doesn’t.
The section is divided into three categories.
-
All Posts. A list of posts along with information on post type, targeting, reach, and engagement.
-
When Your Fans Are Online. Knowing when fans are on Facebook helps admins determine the best time of day to post to get content seen by the most people. That’s what this report shows.
-
Best Post Types. This area shows how each type of post — Status, Photo, and Link — rank according to reach and engagement.
People
This section includes information on people who like a Page. Enlarge This Image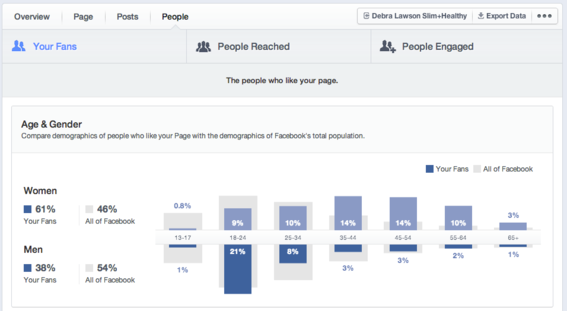
Here admins can find out more about who likes a Page and who likes, comments on, and shares its posts. It also shows how fans are similar and different from other people on Facebook, as well as common traits of the people who like, comment on, or share posts.
In the previous version, Page Insights showed demographic breakdown — age, gender, country, city, and language — of who was reached. Now, Insights allows admins to see not only who has been reached, but who has engaged, as well. This helps Page admins identify the types of content that is resonating with different audience segments to better inform their Page content and strategy.
Wrap up
This new version of Insights should make it easier for Page owners and administrators to improve the effectiveness of posting activity and drive better marketing results.

