The start of a new year presents an opportunity to review your marketing activities of the prior year. In this article, I’ll walk you through a basic annual review for your affiliate marketing efforts.
Financial Review
Key financial performance indicators for your affiliate marketing are likely similar to metrics you use to evaluate all other marketing channels. For each month of the prior year, pull the following data.
- Gross revenue. Total sales dollars generated by the affiliate channel.
- Affiliate commission. Total dollars paid out to affiliates that is directly attributed to transactions. This could also include any expenditures associated with affiliate promotions such as bonuses for achieving sales targets.
- Fixed placement fees. Total dollars paid out to affiliates that are not associated with transaction. For example, if you paid a blogger a fixed fee to write a product review, or to put your banner in its sidebar, that expenditure would be considered a cost associated with fixed placement.
- Network fees. Total dollars paid out to the affiliate network for tracking services.
- Reversals. Total dollars associated with product returns. You may or may not have been able to retrieve commissions paid out to affiliates on these orders
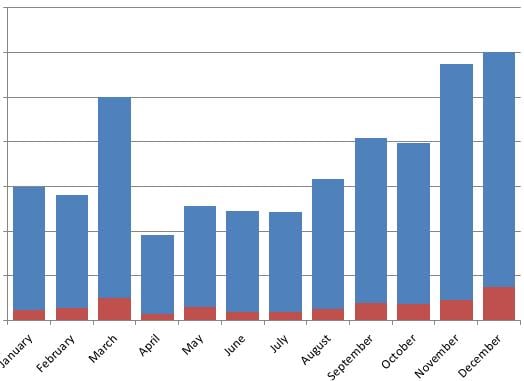
From here, create a simple bar chart that shows net revenue (gross revenue minus reversals) and gross expenditures (sum of affiliate commissions, fixed placement fees, and network fees) on a single plot. Such a graph will provide a visual representation of seasonality, which you can compare to other marketing channels. Like the chart below, you may notice that the affiliate channel provides strong performance in March. If this is the case, then it is worth investigating what drove this lift, to see if you can replicate and optimize it for the following March.

Gross expenditures as a function of gross sales through the affiliate marketing channel.
Affiliate Performance Review
After evaluating the financial metrics associated with our affiliate channel, the next step is to evaluate actual performance. To do this, pull the following data for each month of the prior year.
- Number of affiliates. Total number of affiliates within your program.
- Number of active affiliates. Total number of affiliates who drove at least one click each month.
- Number of sales-generating affiliates. Total number of affiliates who drove at least one sale each month.
- Clicks. Total number of clicks driven by month.
- Number of Transactions. Total number of transactions driven by affiliates each month.
Notice, I am not looking at individual affiliates yet, simply at the channel as a whole. By tracking the number of affiliates in your baseline month-over-month, you can gauge the impact of your recruiting efforts. Younger programs will likely see something close to 70 percent growth each month in the sheer number of affiliates. Older programs are still considered healthy if there’s 2-to-5 percent growth in the number of monthly affiliates. However, remember, this number by itself isn’t enough to gauge whether or not an affiliate program is successful. It simply means that your recruiting efforts are functioning.
A better metric of affiliate channel performance is the percentage of your affiliates that actually drives traffic each month. — 30 percent is a standard industry benchmark. Compare the fluctuations of this metric with your seasonality, to see if financial performance can be correlated with increased affiliate activity.
You’ll also want to know what percentage of click-generating affiliates is driving a sale, not just producing traffic. This will vary depending on your industry. You want to ensure that you’re not dependent on a small handful of affiliates. For example, if 90 percent of your sales are driven by three affiliates, what happens to your affiliate program if one of those affiliates defects to your competitor? In affiliate marketing, there are rarely exclusivity agreements between retailers and affiliates. Either party can terminate at any time. For this reason, ensure that you have a diverse base of affiliates driving sales.
Finally, track the clicks and number of transactions driven by your affiliates each month. Divide the number of transactions by the number of clicks to derive the conversion rate, and make sure that the conversion rate is in line with sitewide performance. If it’s too low, or too high, investigate the reasons why. A high conversion rate could be an indication of trademark bidders driving sales within your program; a low rate could indicate that affiliates are driving non-targeted traffic.
Conclusion
In this article, I’ve offered a basic approach to reviewing the annual performance of your affiliate channel. There are ways to delve deeper into the numbers, for sure, such as gauging specific product performance and tracking the effectiveness of particular consumer promotions.


