A common practice among retailers is creating microsites to target different audiences. The strategy can produce strong conversions because the user experience is simpler and more relevant. Unfortunately, it is not usually helpful for organic search rankings.
In a January 2019 “Think with Google” article, Sean O’Keefe, a member of Google’s in-house search engine optimization team, addressed the issue. He described Google’s process for optimizing search rankings for its own websites. O’Keefe explained that Google published six separate websites for retail marketing. The content of each was similar, with much overlap. Google combined the six sites, focusing on “one great website.” The results, according to O’Keefe, were a 64 percent increase in organic traffic and a doubling of the site’s key call-to-action clicks.
He explained:
It can be tempting to create multiple websites, each containing very similar content, to target different customer profiles or geographic regions. In fact, it’s something we’ve done at Google. A recent audit revealed that, over the years, we had developed a large number of near-duplicate sites based on different campaigns or marketing goals.
Here’s the problem with that approach: duplicate content is not only confusing for users, it’s also confusing for search engines. Creating one great site instead of multiple microsites is the best way to encourage organic growth over time.
My firm recently performed a similar merger as what O’Keefe described. We combined a client’s two branded ecommerce sites into one. But given the SEO risk, we first conducted a “simulated merger.”
Simulating Mergers
To start, we identified the top organic landing pages by traffic that were common between the two brands. Then we set canonicals on brand B to point to the corresponding pages on brand A. We tracked (i) when Google removed the brand B’s pages from the index, and (ii) the combined weekly organic traffic to both sets of pages.
Initially it didn’t seem like a good idea to go ahead with the merger. But after 30 days, the year-over-year traffic to brand A was higher than the combined historical traffic. So, we moved forward, confident that the merger would generate more organic traffic, not less.
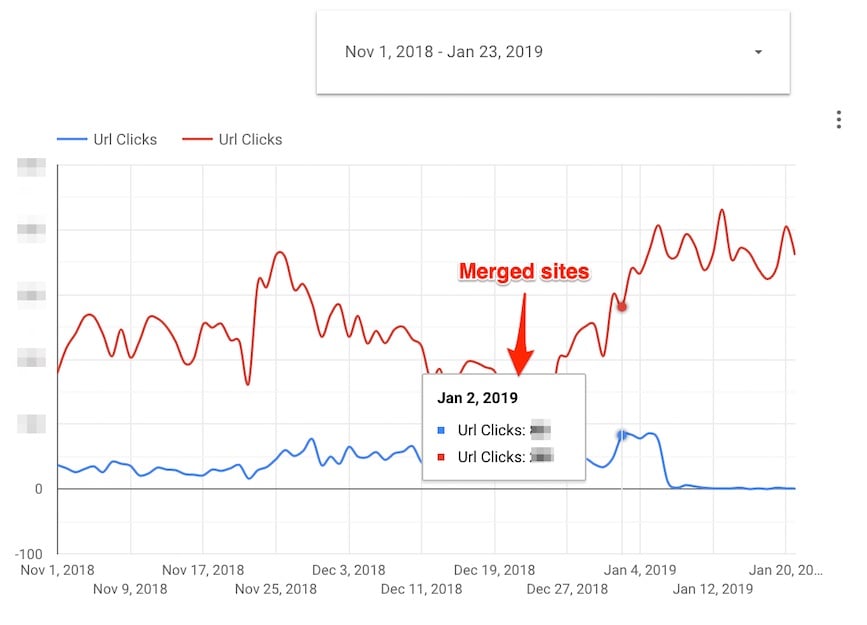
After 30 days, the year-over-year traffic to brand A was higher than the combined historical traffic. Click image to enlarge.
Monitoring Mergers
After we launched the 301 redirects to merge brand B into brand A, we wanted to track the traffic impact. We used Google Data Studio, which integrates easily with Search Console. Last year, Data Studio added a feature that allows “data blending” from different sources. In our case, we want to blend Search Console data (from the HTTPS profile) for both sites.
As you can see in the chart above, the organic search traffic to brand A’s site is higher than the combined traffic before — even more than the combined holiday traffic. We expect this to grow even higher.
What follows are our steps to assemble the report in Google Data Studio.
Step 1. Click on “Create New Data Source” and then search for Google Search Console.
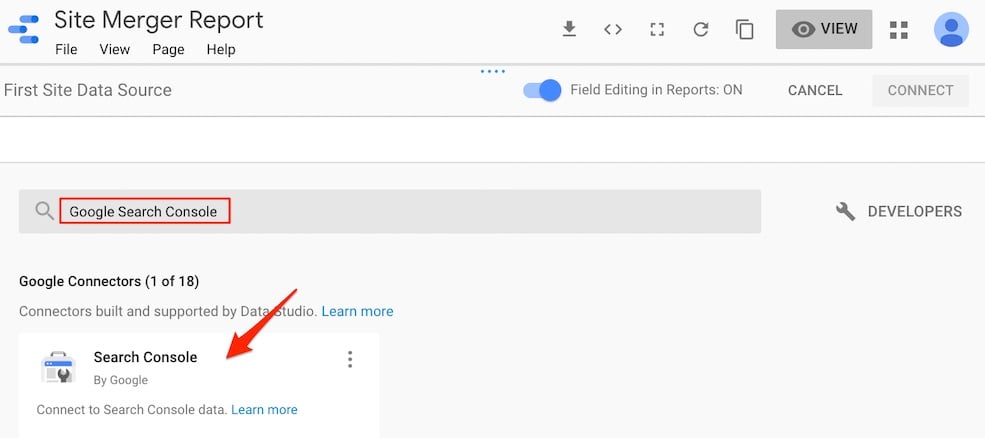
Click on “Create New Data Source” and then search for Google Search Console. Click image to enlarge.
—
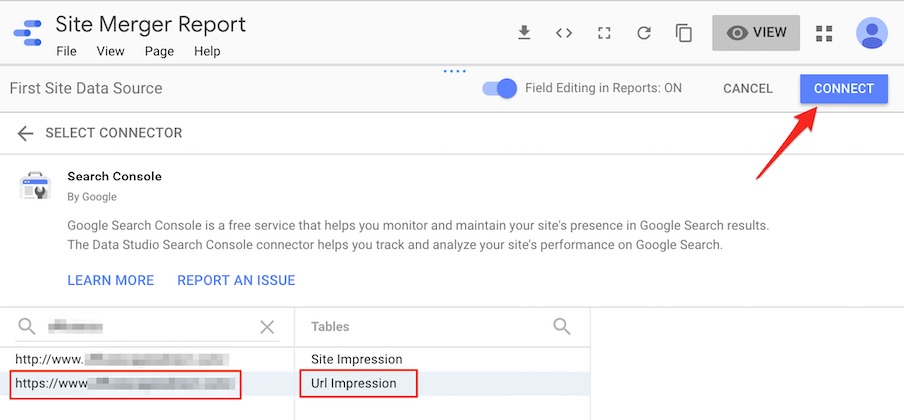
Step 2. Search for the profile in Search Console for the first site (generally the HTTPS version) and click “Connect.”
—
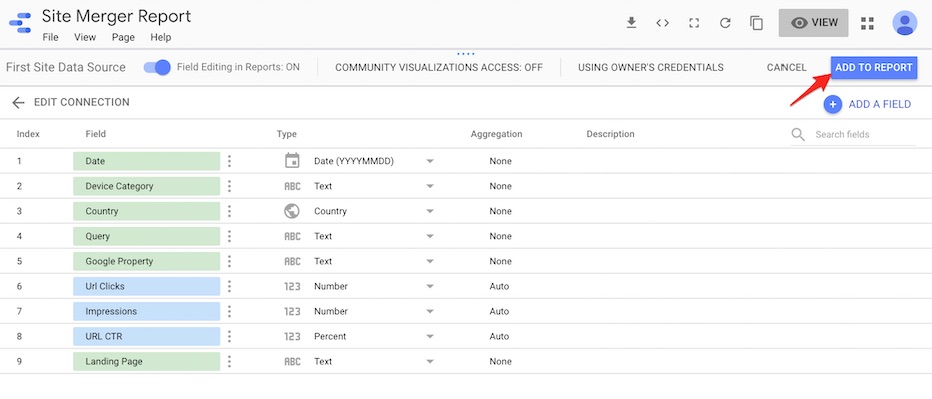
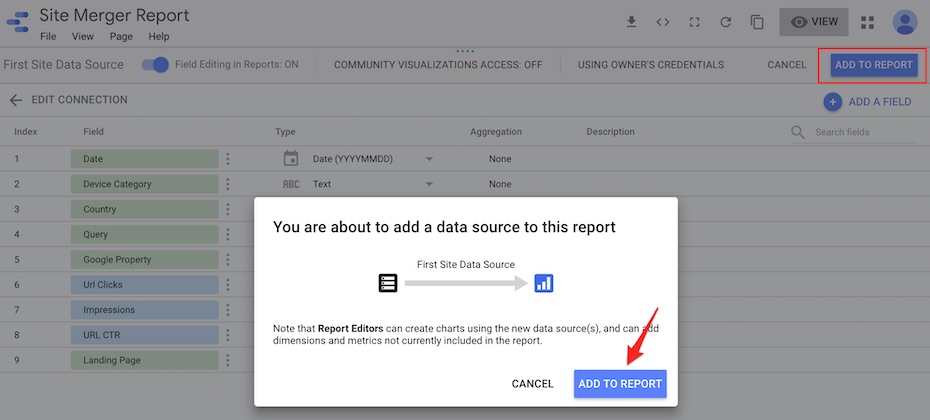
Step 3. Click on “Add to Report” to import the first site’s data.
—
—
Step 4. Under the “Resource” menu item, click on “Add a data source” to import the second data source using the correct Search Console profile of the second site (brand B). Repeat steps 2 and 3 to add the second data source.
—
Step 5. Select the date and chart to your report canvas. This will display the URL clicks to the first site.
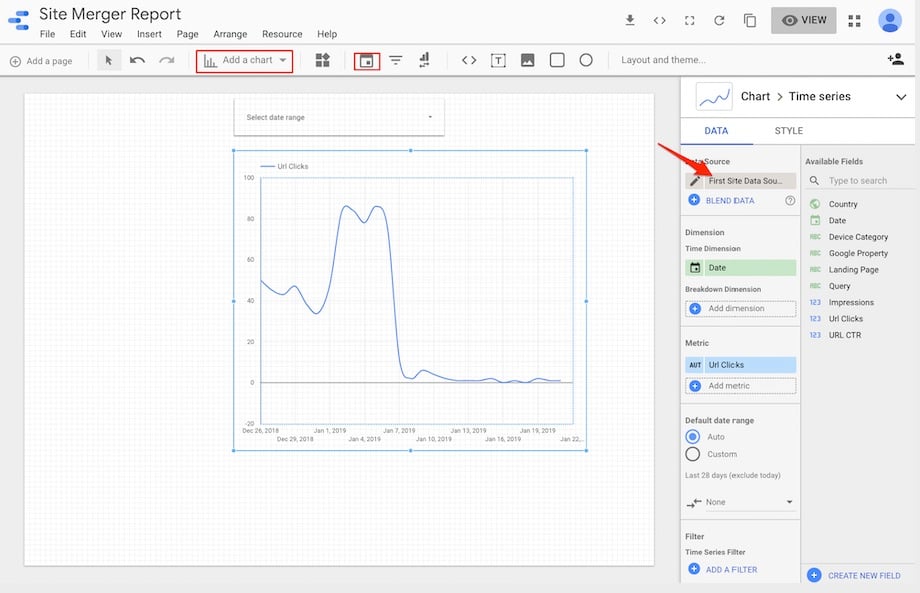
Select the date and chart to your report canvas to display the URL clicks to the first site. Click image to enlarge.
—
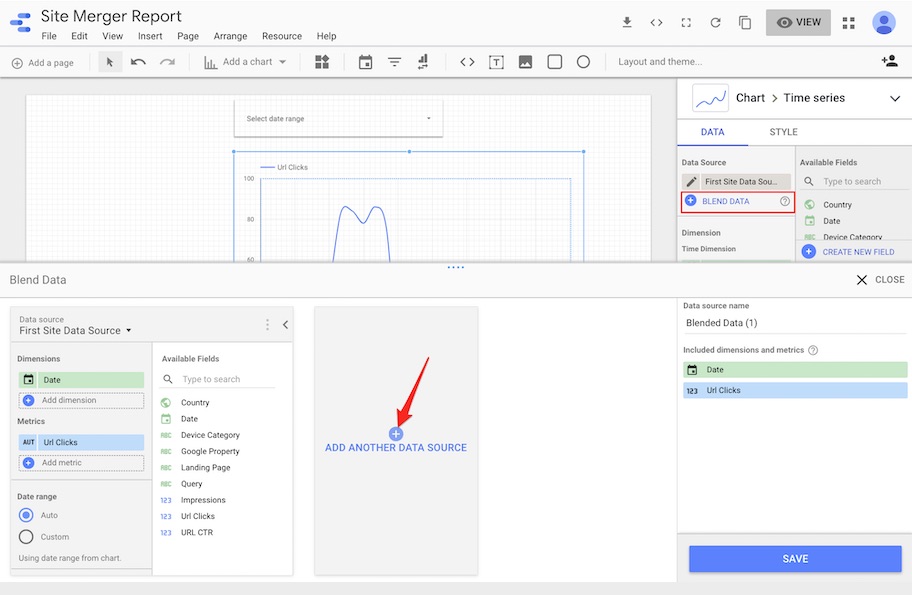
Step 6. Click on “Blend Data” to add the second data source.
—
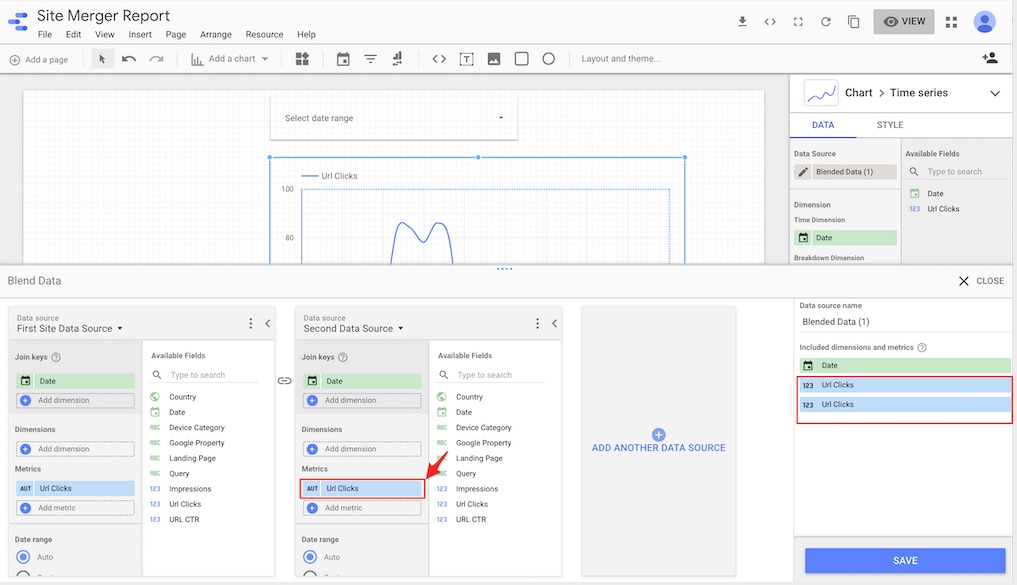
Step 7. After you add the second data source, make sure to add the same metric for both. In my case, it was URL Clicks — using the same metric twice. Click on “Save.”
—
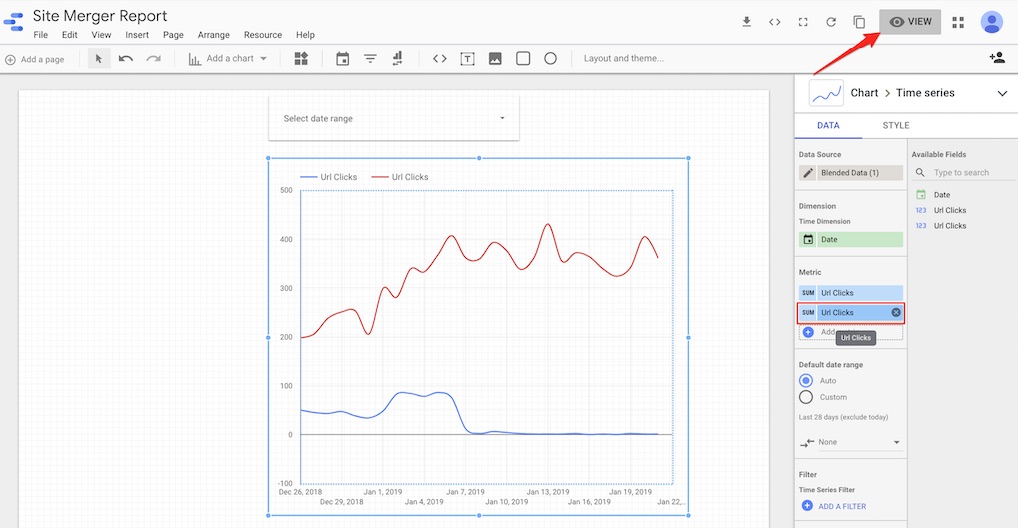
Step 8. Finally, add the second site’s URL Clicks metric to the report builder, and click on “View” to select your desired date range.
Recommended

Remembering Hamlet Batista
February 8, 2021

