You may have noticed blue, hyperlinked performance stats recently in your Google Ads interface. This is a new feature called “explanations.” In this post, I’ll explain explanations and how they can improve results.
From the Google Ads Help section:
Explanations give you insights into large changes in your Google Ads account performance. When you see a significant fluctuation in performance for a Search campaign or ad group, explanations help you quickly find out why it happened.
Most managers are aware of account fluctuations via, for example, spikes on a dashboard or an email from a client’s call center about low volume. Fluctuations typically spark a flurry of research as to the cause. Explanations is Google’s attempt to automate the process with machine learning.
Explanations launched several months ago. They appear in only a few places as I write this:
- In Search campaigns,
- With manual or enhanced cost-per-click bidding,
- For metrics on clicks, impressions, cost, and conversions,
- For the previous 90 days.
This is limited, to be sure. But likely Google will quickly expand it to Shopping and Display campaigns. Performance variations in Shopping campaigns often come from Google Merchant Center issues. It would be natural to notify the Google Ads manager that clicks are down because, say, 15 products were disapproved in the latest feed. Certainly Merchant Center notifications exist already, but explanations would integrate the two products better.
How to Locate
Make sure you have Search campaigns running on manual or enhanced CPC. Then, navigate to those campaigns by clicking on “Search campaigns” in the upper left.
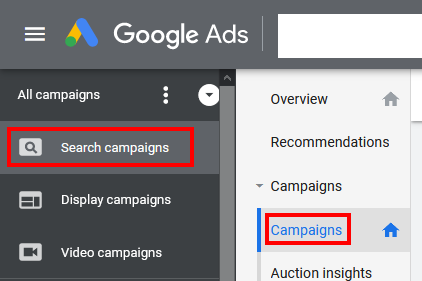
Make sure you have Search campaigns running on manual or enhanced CPC. Then, navigate to those campaigns by clicking on “Search campaigns” in the upper left.
In Search campaigns, choose a date range of fewer than 90 days — I prefer the last 30 days — and then you’ll see something like this.

In Search campaigns, choose a date range of fewer than 90 days. Click image to enlarge.
Notice the two red boxes above. This highlights the hyperlinked metrics for my clicks (750), impressions (6,329), cost ($471.45), and conversions (274.00).
Hover your mouse over one of the blue metrics, and you’ll see a screen tip. In the example below, Google Ads is telling me that I have 750 more clicks than the previous 30 days. The tip makes sense because the campaign is new.

Hover your mouse over one of the blue metrics for a screen tip, such as receiving 750 more clicks than the previous 30 days.
Clicking on the View Explanations link produces a pop-up on the right side of the interface. This box identifies the campaign (which I’ve blacked out, below), the time frames, and the metric you were looking at (clicks, in this example). The box tells you what changed and what that could mean for your campaign. The box below states that I added one negative keyword list and 75 negative keywords. Adding the negative keywords led to 27 percent fewer impressions and 14.85 percent fewer clicks.
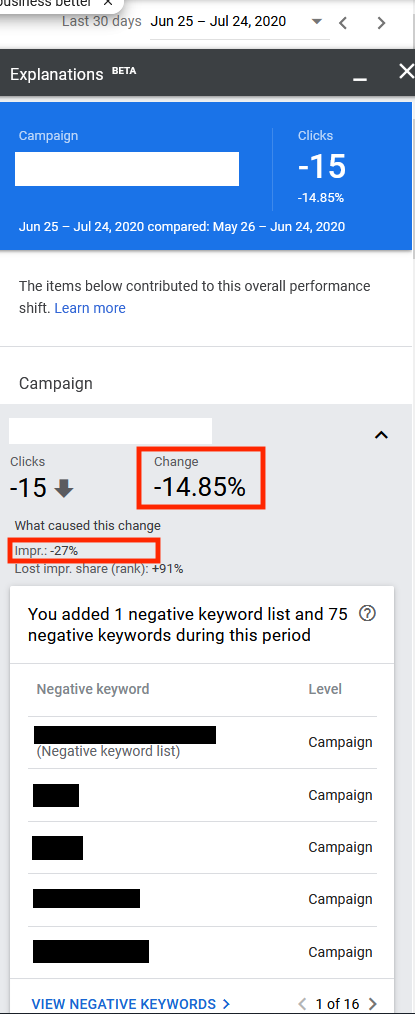
Clicking on the View Explanations link produces a pop-up that identifies the campaign, the time frames, and the metric, such as clicks. In this example, adding the negative keywords led to 27 percent fewer impressions and 14.85 percent fewer clicks.
Keep scrolling, and you may see more. We see in the screenshot below that I changed the bid modifier on several states. We also see a list of competitors and how often their ads appear higher than ours. In this example, ads from the first and second competitors appear higher 6 percent and 4 percent of the time, respectively.

This screen shows changes to bids during the period as well as a list of competitors. Ads from the top competitor appeared higher 6 percent of the time.
Additional explanations are possible. Regardless, a diagnostic report is at the bottom. All told, explanations include nine areas of a Google Ads account. It’s a thorough review. “Bid adjustments” consists of all bid modifiers: device, location, demographic, audience. Providing competitor info can surface non-obvious changes.

Explanations include nine areas of a Google Ads account.
A Helpful Feature
Nothing in explanations is new. All info exists already if you know where to view it. However, not all advertisers know, for example, to look at their Auction Insights for competitor behavior. And one account user might not know about the negative keywords that were added by someone else.
In short, I’m impressed with explanations. The feature checks many areas automatically and presents them in a user-friendly format. Yes, appearing only on cost-per-click campaigns is an effort by Google Ads to increase automated bidding. Nonetheless, the data is helpful in identifying problems and opportunities quickly.