Market basket analysis is based on the idea that a customer who buys product A is likely to buy product B, too. The model seeks to find relationships among purchases — a customer who buys pasta likely needs pasta sauce. The model applies at an item level or to a group of items or categories. A customer who purchases golf items (a category) is more likely to purchase tennis items (another category) than football.
Large retailers and enterprise ecommerce platforms often use modeling tools such as SAS, SPSS, or data science packages for R or Python. If you have extensive datasets — thousands or more transactions — market basket analysis more or less requires a software package or a tool. However, smaller retailers with relatively fewer SKUs and limited budgets could perform the analysis manually.
In this post, I’ll explain the basics of market basket analysis.
Small Datasets
Companies with fewer products could conduct a manual analysis. First, put all transactions, with all product combinations, into a spreadsheet. Next, run a pivot table to list the most popular combinations for all transactions.
In the example below, the most popular combination is t-shirts and jeans.

Put all transactions, with all product combinations, into a spreadsheet. Next, run a pivot table to list the most popular combinations for all transactions. In this example, the most popular combination is t-shirts and jeans with nine transactions. Click image to enlarge.
An alternative method, which is more time consuming, is to identify all transactions that included jeans and an additional item. Then, by listing those combinations, merchants can calculate the probability of buyers of jeans also including, for example, t-shirts, or shoes, or belts.
In the below example, 20 transactions included jeans. Ten of those, or 50 percent, also included a t-shirt. Two, or 10 percent, included a belt.

An alternative method, which is more time consuming, is to identify all transactions that included jeans and an additional item. Then, by listing those combinations, merchants can calculate the probability of buyers of jeans also including, for example, t-shirts, or shoes, or belts. Click image to enlarge.
Large Datasets
Using the manual methods, it is easy to see what customers are likely to purchase in combination. But these simple approaches work only for small datasets of a few products. If you have hundreds or thousands of products, you’ll presumably require a data science package. Your analysis would then look something like this.
If you have hundreds or thousands of products, you’ll presumably require a data science package to identify likely product combinations.
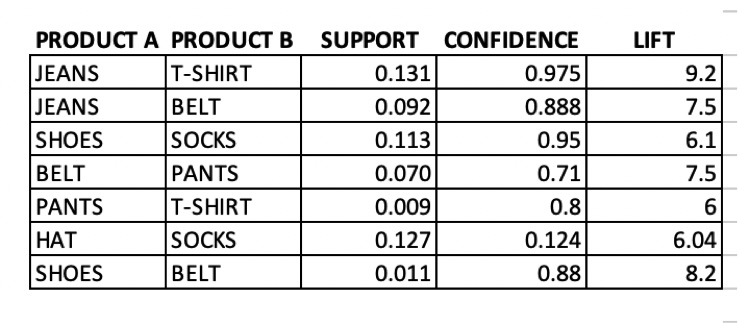
- “Support” is the percentage of transactions that have product A and product B. The higher the number, the greater the frequency. In the example above, the most common combinations are jeans and t-shirt (0.131), and hat and socks (0.127). The least popular combination is shoes and belt (0.011).
- “Confidence” calculates the probability of someone purchasing products A and B together. The higher the number, the higher the chance that someone who has purchased product A will purchase product B. In this example, the combination of jeans and t-shirt had a high confidence level (0.975). Conversely, the combination of hat and socks was low (0.124). Most likely, customers that buy socks will not buy a hat.
- “Lift” summarizes the association between products. The larger the lift, the greater the association of the two products. Lift is an easy way to make decisions, versus support or confidence. In this example, we would focus on promoting t-shirts when customers place jeans in the cart (lift is 9.2) and promote belts with shoes (8.2).
Potential Combinations
Most items that could be sold together are intuitive, such as a toothbrush with toothpaste. Others can be bizarre, in my experience. It could be that jeans and barbeque plates have the biggest lift, for example. Therefore, step one is to review the results and rule out any combination that makes no business sense. Then change your marketing and page layouts to match the items.
Consider A/B testing the layout and marketing approach before deploying. Example tests include:
- Placing product B next to product A on the same page.
- Showcasing how product B goes together with product A — e.g., photos of guacamole sauce with chips when selling one or the other.
- Coupons and placement of product B when product A is in the shopping cart.
- Email customers that purchased product A with an offer for product B.
Other Uses
Market basket techniques can apply to other aspects of an ecommerce business, such as:
- Product categories. Review your product categories to generate ideas for new ones. For example, a category of swimwear may suggest creating a new line for sunglasses. Then, cross-sell items from each category.
- Segments. Instead of focusing on product, try segmenting by customer interest or other demographic or psychographic data.
- Content marketing. Do consumers who read instructional blog posts also read top 10 lists? If so, suggest one or the other for further reading.
- Promotions. Do customers who respond to a 10-percent off coupon also respond to $5 off?