Consumers who search on Google are expressing a need. Data from those searches is powerful for marketers.
Google’s Keyword Planner provides statistics on searches, such as “estimated search volume.” While that metric is helpful, it’s also imprecise.
Rather than focusing on specific terms, ecommerce merchants can benefit from monitoring broad search trends, such as seasonality. Many products are seasonal, after all.
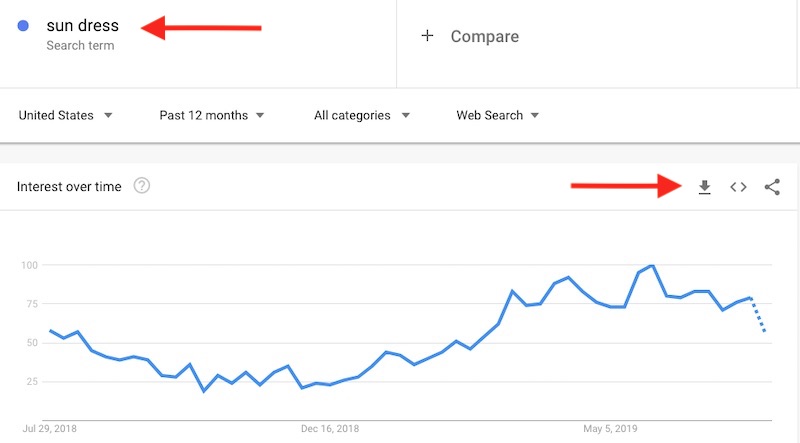
Here’s an example. Sun dresses are common summer apparel. Shoppers become interested in sun dresses as soon as February in the Northern Hemisphere. Thus search optimizers should start focusing on sun dress products and categories at least in January.
Obtaining the Data
Google Trends reports the relative popularity of search terms across languages and regions. It’s helpful for identifying when, say, consumers start thinking about sun dresses. While it may have once been on Google’s roadmap, an official Google Trends API isn’t available. I tried a couple of unofficial APIs but didn’t succeed in getting a scalable dataset.
So the easiest way to obtain data from Google Trends is to scan (or scrape) it right in the Trends website or via .csv export.
While manually entering each keyword may not be quick, you can speed up your research by choosing keywords selectively. Many terms in Google Trends simply don’t report data. Presumably they aren’t popular enough. So scrub your list to popular head terms.
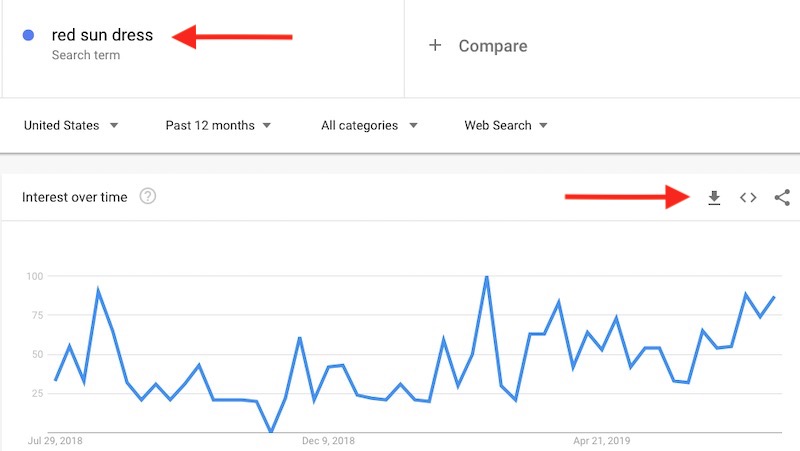
In my experience, even if you search long-tail phrases, Google Trends usually shows the same type of trend line as the head term. For example, “red sundress” does chart. But it follows the same seasonal trend as “sun dress” with the incline starting in February.

Google Trends data for the U.S. shows that interest in red sun dresses starts early in the calendar year. The download arrow is on the right. Click image to enlarge.
—

The long-tail term of “red sun dress” closely follows the head term of “sun dress,” as shown above. Click image to enlarge.
Downloading
Download the data by clicking the small down arrow icon, as shown in the screenshots above.
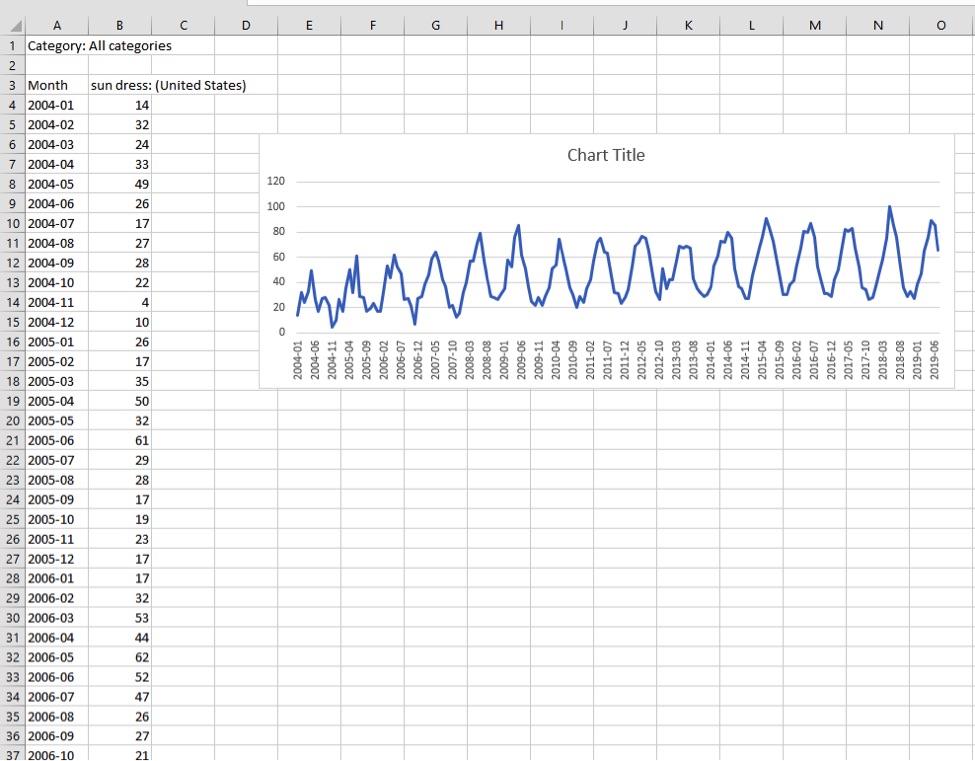
The export is basic. Charting the data in a spreadsheet can provide a similar line graph as seen in the Google Trends website.

Charting the data in a spreadsheet can provide a similar line graph as seen in the Google Trends website. Click image to enlarge.
Remember, the data is not estimated search counts; it’s a relative score of popularity — broad, directional information. I can’t stress that enough.
Applying the Data
Using Google Trends data at least once a year will provide a calendar of sorts for promoting products — sun dresses in February, for example.
Most ecommerce websites are so large that you can’t optimize every product or category without hiring a large team. Thus analyzing other metrics could be helpful, such as:
- Historical sales. While consumers might be interested, does your site sell sun dresses in February? Validate with historical data.
- Margin. Focus on the most profitable items. Work your way down to the least profitable.
- Estimated search volume. A product with a higher search volume may produce more sales.
In my experience, merchandisers are always surprised by Google Trends data. Partnering with merchandisers can help them understand what products mean the most to the business, extending the data beyond SEO.


