Pay-per-click advertising provides advertisers with much data about what potential customers are searching for, what messaging resonates with them, and how campaigns are performing. There is so much data, in fact, that it’s often difficult to know what to focus on.
When Google launched AdWords back in 2000, it was a simple administrative interface. AdWords touted that in five minutes you could get your ad in front of millions of people. But now, in 2016, AdWords is a full-blown enterprise tool. The AdWords admin contains multiple layers of tabs and more drop-down menus than you can shake a stick at. (My grandma is fond of that term, although I’m not sure what exactly it means. Let’s just agree that it means “a lot.”)
Because of its sophistication, AdWords produces much data that is potentially helpful, but not necessarily easy to find or easy to sift out.
So as you wrap up 2016 and get ready for 2017, here are three critical reports, below, that you should run in your AdWords account before year-end. One qualifier: The reports depend on conversion data. If you haven’t set up conversion tracking — and revenue reporting — start there.
Search Term Report
The search term report is perhaps the most valuable in AdWords. It reveals the exact queries searched by the people who are seeing and clicking on your ads. After Google went to HTTPS and blocked this data from third-party analytics platforms, this has been the gold standard for analyzing search queries.
Here’s an example. Assume an ecommerce advertiser wants to look at queries in a Shopping or Product Listing Ad campaign. To do this, she would first navigate to the desired campaign, then click the “Keywords” tab and select “Search Terms.”
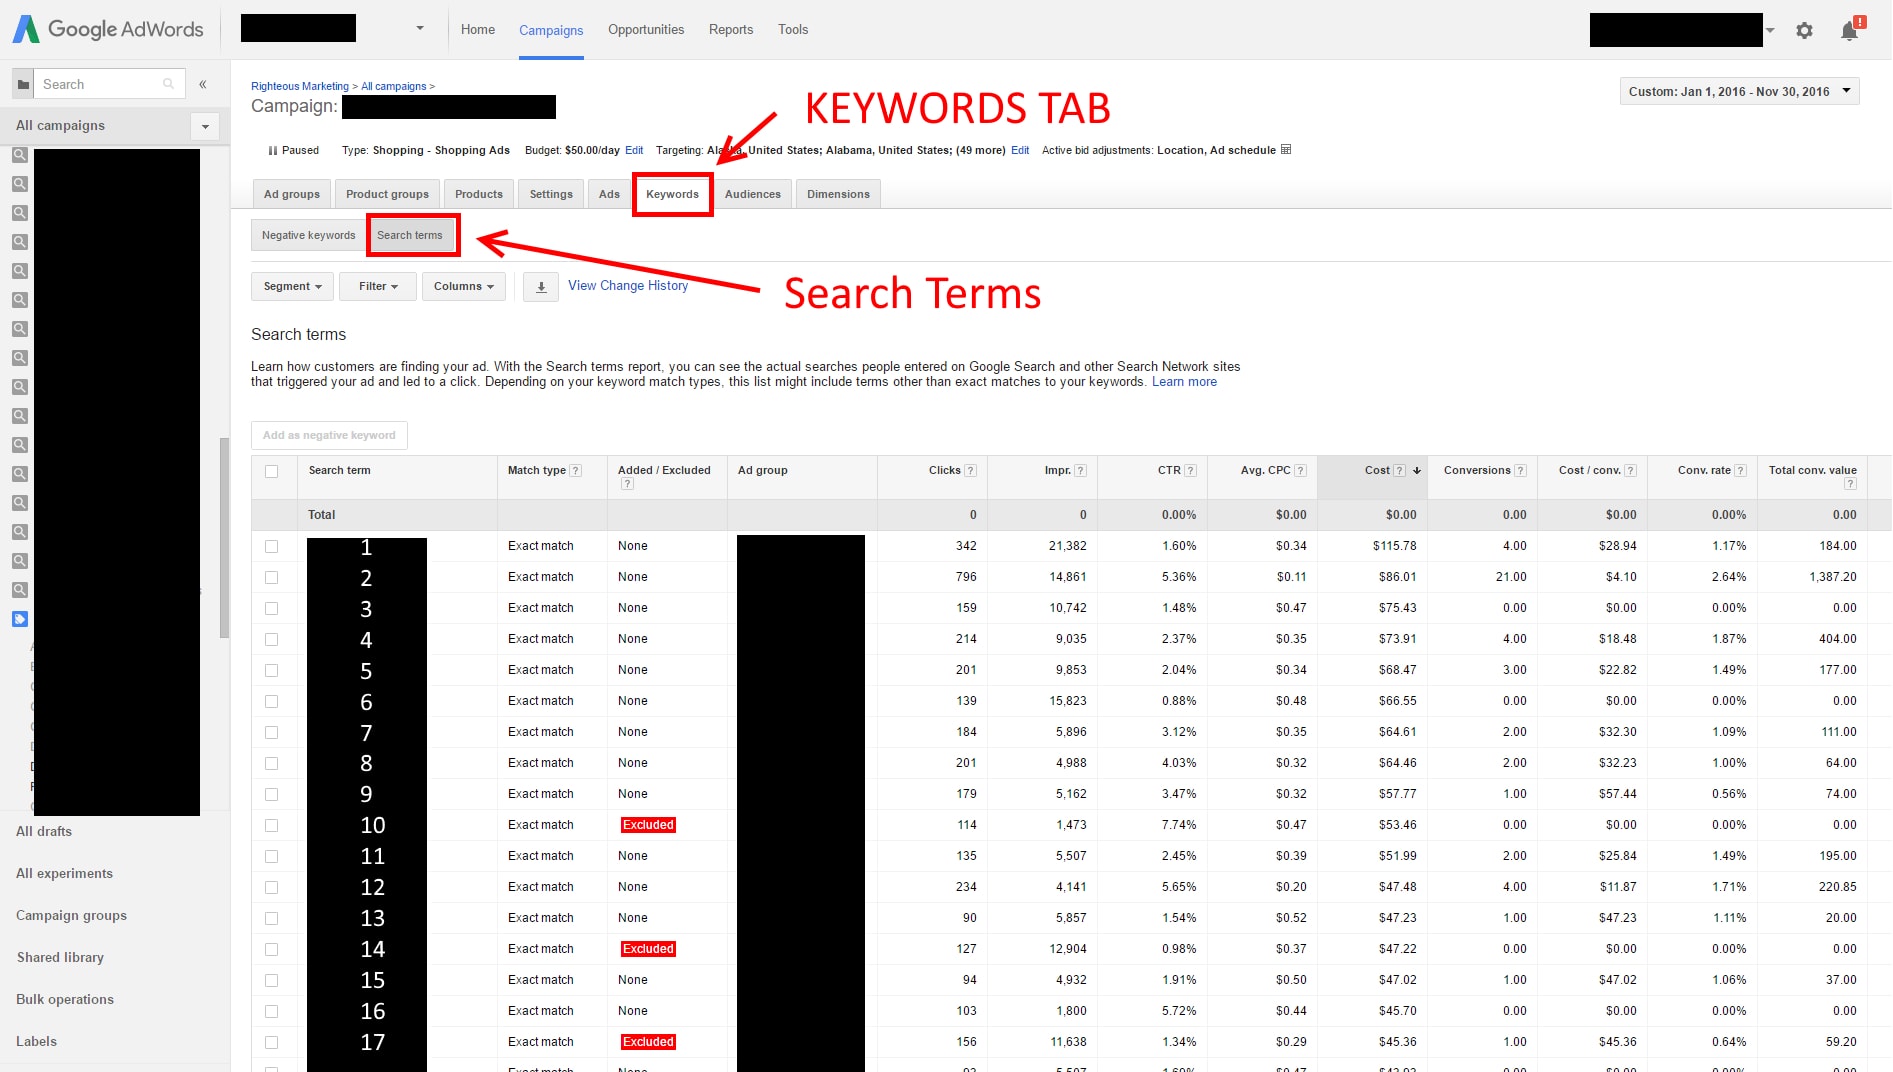
Click the “Keywords” tab and select “Search Terms” to look at queries in a campaign. Click image to enlarge.
Looking at this report can be daunting, but consider these key points.
- Keyword 2 on this report has a phenomenal return. It has driven $1,387.20 of sales on only $86.01 of spend. Looking at the average cost/click (CPC), we see that each click costs just $0.11, which is one-third to one-fifth what other queries cost. The conversion rate of 2.64 percent is nearly double the average.
- Keyword 6 has 139 clicks and no sales. I’ve excluded some non-revenue generating keywords — denoted by the red “Excluded” label — but keyword 6 should likely be added as a negative keyword, as well.
You can click on any column header to sort the data by that column — to surface queries with the most revenue or with the highest conversion rates.
Campaign Settings Report
The Campaign Settings report is important to run occasionally for spot-checking. As you create new campaigns and modify existing ones, it is easy to leave default AdWords settings in place or to miss out on expanding your experience from top campaigns into others. To view the report, navigate to “All Campaigns” and select the “Settings” tab.

A Campaign Settings report can identify improper settings that should be changed. Click image to enlarge.
This snapshot will quickly show inconsistencies among language targeting, geo targeting, bid strategy, networks,, and other settings. If you see an inconsistency, ask these questions.
- Why is this campaign different?
- Would other campaigns benefit from also having this setting?
- Does this setting need to be changed or updated?
I often see high-volume campaigns that are highly optimized, but lower-volume campaigns that are still running on default settings. While you should not automatically apply all settings, the findings of your top-performing campaigns could likely benefit other campaigns.
All Reports Compared to Last Year
Inside the date range selection drop-down menu in the upper right corner you’ll see a small toggle for “Compare” that is defaulted to “Off.”
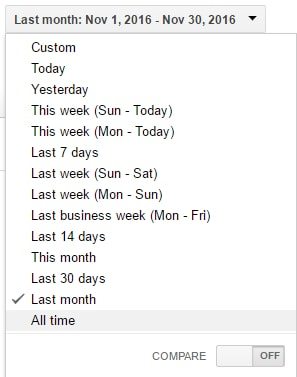
The Compare toggle is normally off.
If you toggle that to “On,” you’ll get the following options.
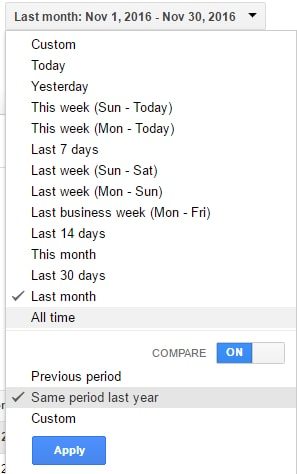
Switching the toggle on allows you to compare previous periods.
Most AdWords advertisers have go-to reports that they watch closely. It could be a campaign report or the keyword report for a top-performing campaign or the ad copy report. Whatever the report, pull it for the past month, quarter, and year and compare it to the same period last year.
Once you’ve set the date range, the data is still hidden. Click the “+” sign at the top of the column to see the comparison. For example, here is a sample revenue breakdown of November 2016 compared to November 2015 for two top-performing keywords.
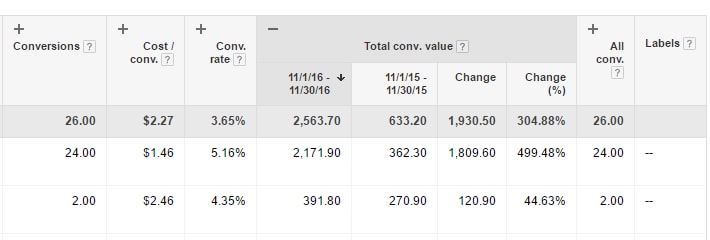
This sample revenue breakdown compares November 2016 to November 2015 for two top-performing keywords. Click image to enlarge.
This shows that keyword 1 has a 499.48 percent revenue growth from November 2015 to November 2016. Similarly, keyword 2 has a 44.63 percent revenue growth for the same period. You could, also, break out impressions to see if fewer people are searching your keywords. You could compare conversion rates, too, for example.