Google Analytics reporting views offer different ways to look at the website or application traffic data, which may help online business owners and marketers better understand how to attract, retain, and convert more site visitors.
When a user creates in Google Analytics a new “property” (i.e., website), Google Analytics automatically shows a single, unfiltered default view that displays all of the data collected. Unfortunately, this is where many marketers and small business owners stop, but each Google Analytics property may have many views or many ways, if you will, of segregating the data in order to get a better understanding or a more accessible insight.
A quick example should make the point. Many ecommerce platforms use an index page to route traffic. In some cases, it will be possible to access a page with or without that index page being referenced. In the example below notice the “index.php” in one URL and not the other. Google Analytics would count these two “pages” separately, even though they point to exactly the same content.

Google Analytics would count the index and non-index pages separately because of the differences in the URLs.
A Google Analytics user could create a new view and filter that would ignore “index.php” and report, perhaps, more accurately that the product page had 300 page views for the time period in view.
3 Things to Remember about Google Analytics Views
Before getting down to the business of creating and using views, there are three things that must be understood.
-
Views are not retroactive. Google Analytics will only track data for a particular view from the moment it is created; it will not include historical data from other views.
-
Always keep the raw data. Views may be most effective when filters are used to exclude, include, or change data. But filters can have unexpected errors, so always keep at least one clean view that has the raw data Google Analytics collected.
-
Test before implementing. When working with views, it is a good idea to add new filters to test views, ensuring that the filter is working as expected before adding it to an important view. Although a filter can be removed, its impact cannot be reversed.
Create a New Google Analytics Reporting View
To create a new reporting view in Google Analytics, navigate to the administration tab by clicking the word “Admin” in the main navigation.
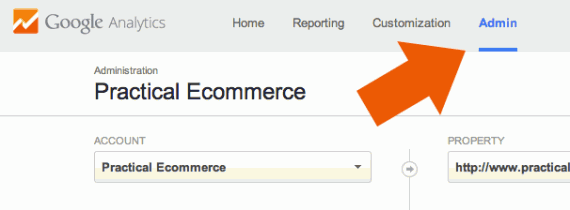
Locate the administration section in Google Analytics’ main navigation.
Select the desired Account and Property. Remember it is possible for an Account to have more than one property.

It is possible to have several accounts and properties in Google Analytics.
Open the view dropdown menu and click the “Create New View” link to open a new page.
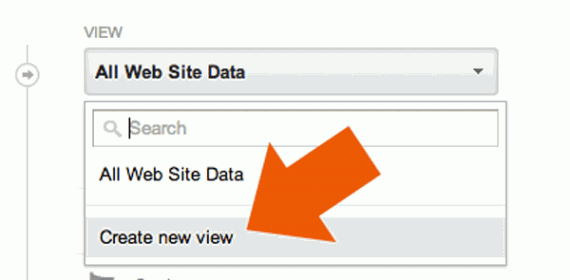
The “Create new view” link is below the list of existing views in the view dropdown menu.
Google Analytics currently supports two kinds of views: mobile app and website. Mobile app views will store data about application errors or the Google Play report while the website view include Site Content reports.
Name the report and set the time zone it should use, and click create to add this new view.
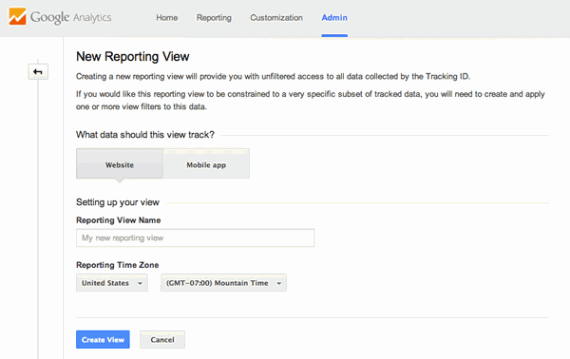
Google Analytics allows website and mobile app views, which have slightly different reports.
Any view’s settings are available by clicking view settings in the administration tab. Remember this view will begin tracking data from when it is created (going forward), but it will not have historical data from any other view.
Add a Filter to a View
Views get most interesting when you customize them with filters. To get started, click the “Filters” link from the View column of the administration tab.
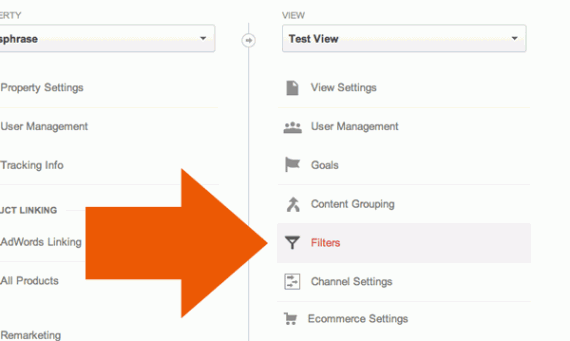
The “Filters” link is in the View column of the Admin section.
A new dialogue will open, click the “New Filter” button to get started customizing the view.
Google Analytics filters can be “Predefined” or “Custom.” The predefined filters try to make it easy to add very common filters. In fact, when the filter configuration page loads it may display a filter that is frequently used to exclude “internal” traffic from the view. Simply put, this filter will ignore all traffic from a particular domain. At traditional companies where all of the employees work in the same building with the same Internet Service Provider domain, the filter will not count these internal users, preventing them from impacting the data. A more refined version of the same filter targets Internet Protocol (IP) addresses or address ranges.
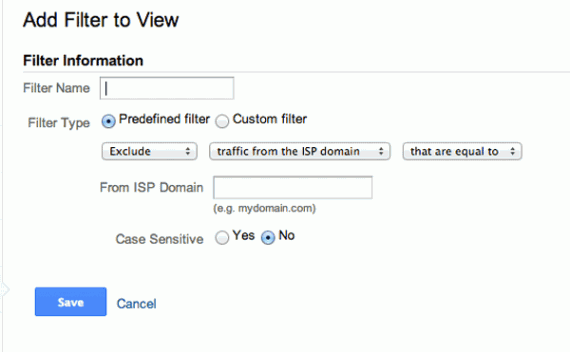
Google Analytics filters can be “Predefined” or “Custom.” The predefined filters try to make it easy to add very common filters.
Custom filters allow users to develop their own unique ways of including and excluding data. As an example, here is a filter that would combine the URLs http://some-store.com/index.php/product and http://some-store.com/product, aggregating page views.
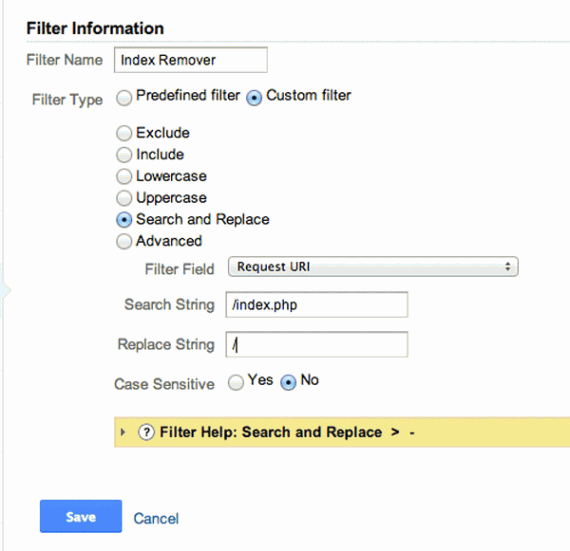
This filter would replace “/index.php” with just a slash, effectively combining data for two URLs.
Notice that the filter type is custom, and it is conducting a search and replace. The string to be replaced is “/index.php,” which includes the leading slash.
Filter Order Matters
If you apply more than one filter to a view, it is important to remember that Google Analytics will process filters in the order applied. So the second filter used will not see all of the data, but rather the output from the first filter.
In its documentation, Google Analytics explains this concept with the example of a filter for U.S. visitors and a second filter for Canadian visitors. This combination of filters would result in, well, no results. The first filter would remove all visitors except those from the United States and the second filter would remove all visitor data except for data from Canadian visitors. The trouble is that there would be no Canadian visitors, since the previous filter had excluded them, and the current data set of only U.S. visitors, would not pass through the second filter.
Rather, a single filter would be needed to include traffic from both the United States and Canada in a single step.

The “” character acts to include both U.S. and Canadian visitors.
Applied correctly, the filter and its associated view will only collect data from American and Canadian visitors, providing a clearly defined subset of data.
Let the Experiments Begin
With a basic understanding of how reporting views and filters work, it is time to experiment. Here are some filter ideas.
-
Visitors from Email Marketing Campaigns Only
-
Returning Visitors Only
-
Visitors from Sites with Banner Advertising
-
Visitors from Your Social Media Pages


