Key email metrics have changed over the years. Many subscribers now receive and respond to email on their smartphones. It has altered multiple aspects of email marketing — content, subject lines, pre-headers, and more.
As soon as an email is deployed, recipients start to open and click. Within a few days, there’s much data to look at to determine what worked, what didn’t, and what to try next.
In this post, I’ll rank the top 10 email metrics for ecommerce merchants.
Top 10 Email Marketing Metrics for Ecommerce
1. Open rate. The open rate still serves as the principal metric for email marketing. An “open” occurs when a recipient receives the email and a 1×1 pixel image is downloaded with the body. The open rate can be misleading. Not all individuals that open an email will download images. Moreover, the image download may not be captured if it is lower in the content. Thus reported open rates are likely lower than the actual.
Despite this, the open rate is a reliable indicator of how many people viewed an email message. It helps marketers understand whether subscribers are engaged. It also indicates the effectiveness of the subject line, preheader, and from line to collectively prompt the recipient to open.
In my experience, average open rates vary dramatically by industry and brand. The single biggest factor is the makeup of the audience. For example, a 10 percent open rate from 500,000 total subscribers might be impressive. Conversely, a 10 percent open rate from individuals who have purchased in the last three months is likely not impressive — it often exceeds 20 percent.
The key is to understand realistic benchmarks for different segments of your file and types of message. A transactional shipping notification, for example, may see open rates of 75 percent or higher, much greater than for promotional messages. Create benchmarks for your open rates by audience or type of email. From there, test the subject line, preheader, and from line to improve.
2. Click-to-open rate. There are different methods to calculate a click-through rate. The first option is to divide the number of people clicking by the number of emails delivered. The second is to divide the number of people clicking by the number of people who open.
This second approach is the ‘”click-to-open” rate. It’s the better metric when determining the effectiveness of an email. It tells us whether:
- The creative content is engaging,
- The call-to-action is effective,
- The email is easy to understand and respond to.
In other words, the click-to-open rate could identify areas of the email that need work.
3. Mobile open rate. Open rates for mobile devices and desktop devices depend on the day and time. Desktop users often open emails during business hours. Mobile recipients may have higher open rates on evenings and weekends. Establish benchmarks for each device and then test different send times. If subscribers are interacting and converting well from their smartphones, optimize sending times to capture more of those users. For some brands, mobile devices account for 75 percent of all email opens.
4. Mobile click rate. Click rates on mobile devices are typically lower than from desktops. The two major factors are the ease of clicking from the mobile phone and whether the subscriber is interested in the offer. Maximizing mobile clicks should be a priority for most brands.
5. Open and click rates by domain. This metric is important to know how each of the major domains — Gmail, Yahoo, AOL — are performing in your file. Most email service providers report the breakdown of the top domains and the open and click rates for each. It allows you to see potential deliverability problems. For example, if the average open rate for your entire list is 10 percent, but Gmail addresses open at just 3 percent, there is likely a blocking or filtering issue from Gmail.
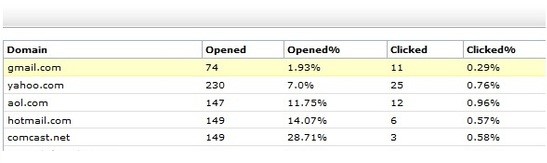
On average, just 1.93 percent of subscribers with Gmail addresses opened the emails from this company. That is much lower than for subscribers using addresses from Yahoo, AOL, Hotmail, and Comcast.
6. Unsubscribe rate. Maintaining benchmarks for individuals who unsubscribe could help to understand why. Are the unsubscribes caused by increased frequency, or poor messaging, or ineffective offers? For spikes in unsubscribes, analyze what was different for a particular campaign to cause the increase. The goal is to keep unsubscribes as low as possible while allowing truly uninterested recipients to leave without issue.
7. Conversion rate. One objective of ecommerce email marketing is to get shoppers to your site. But the ultimate goal is for those subscribers to purchase products. Typically the conversion rate is calculated by dividing the number of conversions — sales, usually — by the number of emails either delivered, opened, or clicked.
Attributing conversions to an email can be complex. The rise of multichannel shopping and diverse purchase paths tend to muddy the calculation. For example, say a subscriber first learned of a product via your email campaign. She then read a recommendation of it from a Facebook friend. Then she saw the product on a Google search. Then she went to your website and made the purchase. Which of those three channels produced the sale?
Regardless, try to benchmark the conversion rate directly from recipients clicking on your email and purchasing an item. Then optimize it by continual testing and tweaking.
8. Bounce rate. There are two types of bounces: hard and soft. Soft bounces may be temporary, such as when an email is returned because the inbox was full. Hard bounces occur when an email is returned from an address that does not exist.
Every email typically has a small percentage of bounces. After all, consumers routinely change email addresses. Your email service provider should automatically remove hard bounces from your file to improve and protect the deliverability of your entire list.
Analyzing bounce rates is especially important for infrequent senders and for new addresses. The first deployment to a new email list may have a higher than normal bounce rate. But it should normalize over time. Healthy lists have bounce rates less than 1 percent.
9. Revenue per email or click. This metric divides the revenue from an email by either the number of opens or clicks. It provides insight into how optimized that email was in generating revenue. The higher the revenue per open or click, the more effective was the email and its offer. The metric can also highlight optimal sending times.
10. Revenue per subscriber. Revenue per subscriber is helpful to understand the overall profitability of your email program. The metric is calculated by dividing all revenue for a period (usually one year) by the average number of subscribers. It represents the rough amount of revenue from each subscriber, which helps determine the break-even amount to acquire new subscribers. Thus revenue per subscriber can be a valuable tool when establishing marketing budgets.