Editor’s Note: This article was originally published by Web Marketing Today. Practical Ecommerce acquired Web Marketing Today in 2012. In 2016, we merged the two sites, leaving Practical Ecommerce as the successor.
It’s time to plan your 2016 marketing calendar and make decisions about which strategies to implement.
This collection of 13 infographics serves as a quick reference guide to concepts such as 2016 marketing trends, social network image sizes, AdWords optimization techniques, social media engagement practices, and more. Use it to spark new ideas and see where business opportunities exist.
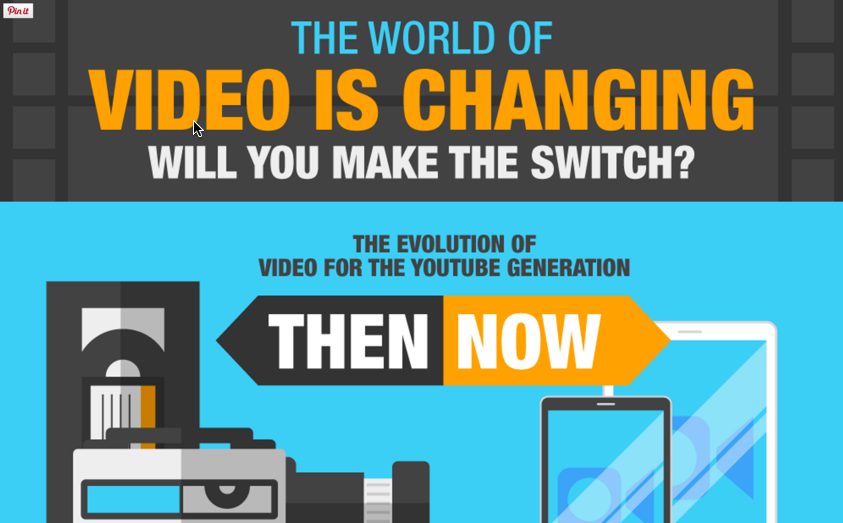
The World of Video Is Changing. Will You Make the Switch?
This infographic examines the history of video marketing and the opportunities for local businesses to use video, with good reason.
From 2005, when YouTube launched its first video to the emergence of Meerkat and Periscope, use of video has become a marketing norm. 75 percent of 18-29 year-olds and 31 percent of those aged 50 and over watch videos on their phone. Videos are expected to make up 80 percent of all Internet traffic by 2019 and 60 percent of all mobile traffic by 2020.
––
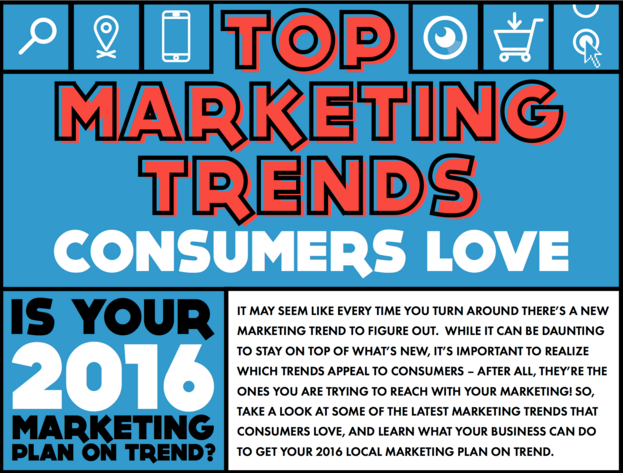
Top Marketing Trends Consumers Love
This infographic looks at the top marketing trends that local businesses need to consider, such as optimizing Google listings for local search, creating mobile-friendly websites, and using streaming apps, buy buttons, and polls and quizzes.
––
How to Become a Twitter Marketing Pro with $0 Budget
Salesforce created an infographic containing tips to help businesses make the most of their Twitter marketing strategy. It includes how to use hashtags, find influencers, cultivate the Twitter feed, and build relationships.
––
The Very Handy Up-to-date Social Media Image Size Guide
This handy infographic, created by ClickZ UK, provides updated image specifications (current as of November 15, 2015) for Twitter, Facebook, Instagram, Google Plus, Pinterest, LinkedIn, and YouTube.
––
Adwords Optimization Made Easy with These 3 Workouts
Marketing agencies Unbounce and KlientBoost created three 10-minute AdWords optimization “workouts” in the form of infographics.
“The Slimmer” helps you decrease your AdWords ad budget by managing keywords, adjusting ad schedules, changing geographic locations, adding negative keywords, increasing quality scores, and reviewing landing pages.
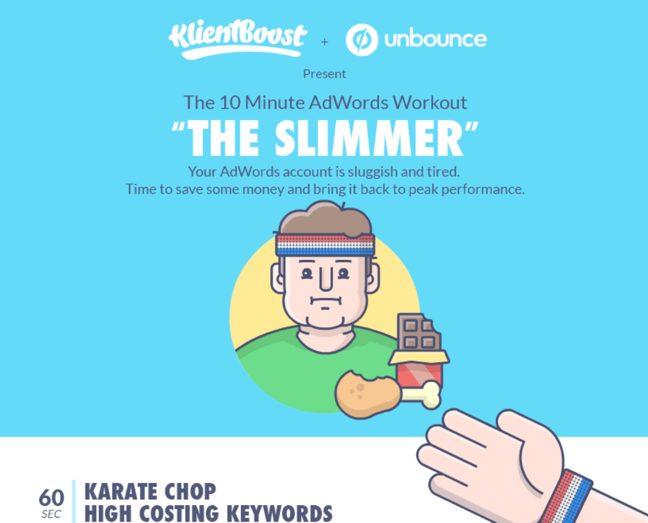
10-minute AdWords workout: “The Slimmer.”
“The Maintainer” infographic helps businesses keep their AdWords account healthy, in just ten minutes a week. Tasks include negative keyword management, bad and good ad and keyword management, and the use of custom filters.
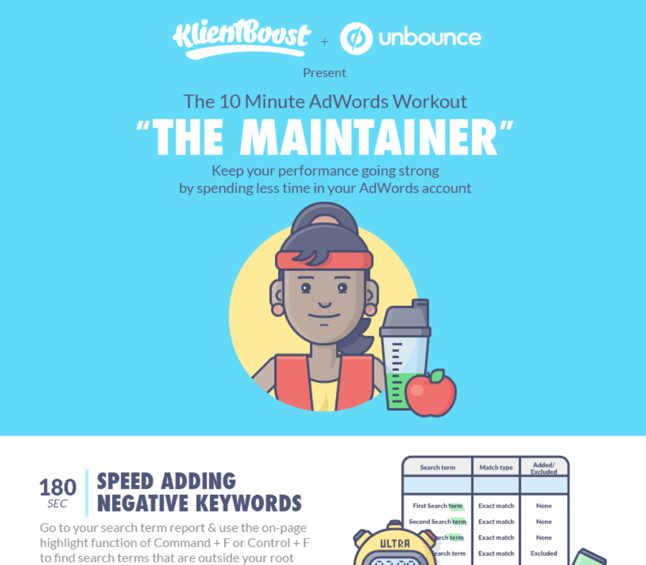
10-minute AdWords workout: “The Maintainer.”
If your AdWords account is performing well, look at “The Bulker” infographic. It shows you how to increase impression share, spy on competitors, mine keywords, modify bids, and test ad extensions.
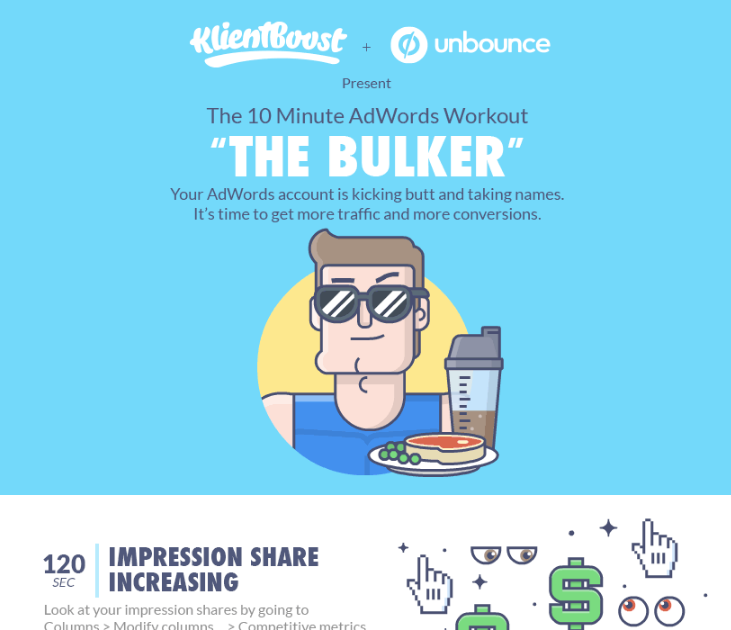
10-minute AdWords workout: “The Bulker.”
––
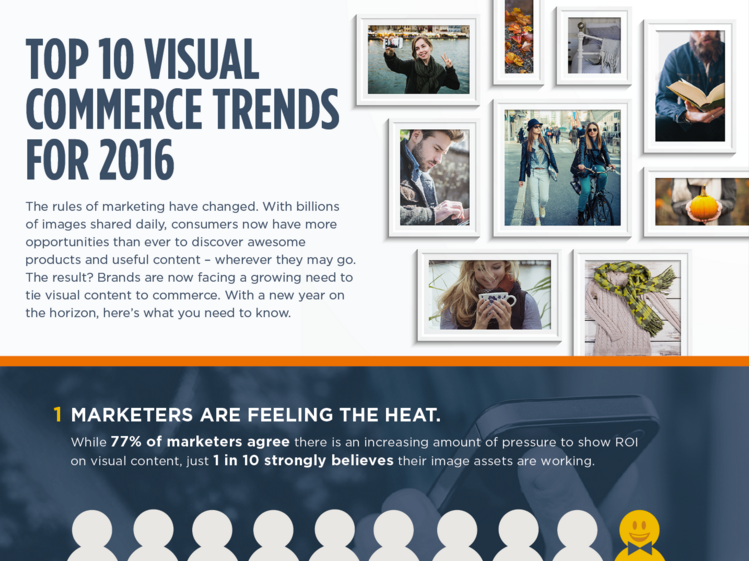
Top 10 Visual Content Marketing Trends for 2016
Curalate, a visual commerce platform, defines visual commerce as “the emerging and essential need to show how images engage and convert customers at every point of the purchase funnel.”
This infographic shows the opportunity available to marketers if they can better match the image to their product and service. For example, 86 percent of marketers agree that the online marketing channel and its audience is important when selecting images to use in different marketing initiatives, but 78 percent use the same image versus a different one across all of the channels.
––
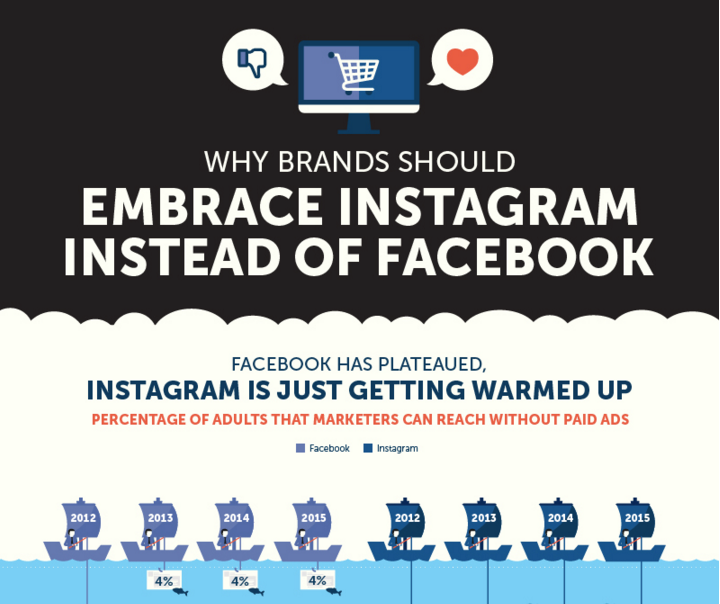
Is Instagram More Powerful than Facebook for Ecommerce?
Most businesses recognize that Facebook’s organic reach (not paying for the audience) has been diminishing. In fact, since 2012, Facebook has had a 63 percent decrease in organic marketing reach, mainly due to its use of filters.
According to this infographic, brands only reach 6 percent of their followers per post on Facebook. Instagram users had an 115 percent increase in their reach, with 100 percent of their followers seeing each post. An opportunity exists for businesses that have the ability to make their products or service visual.
––
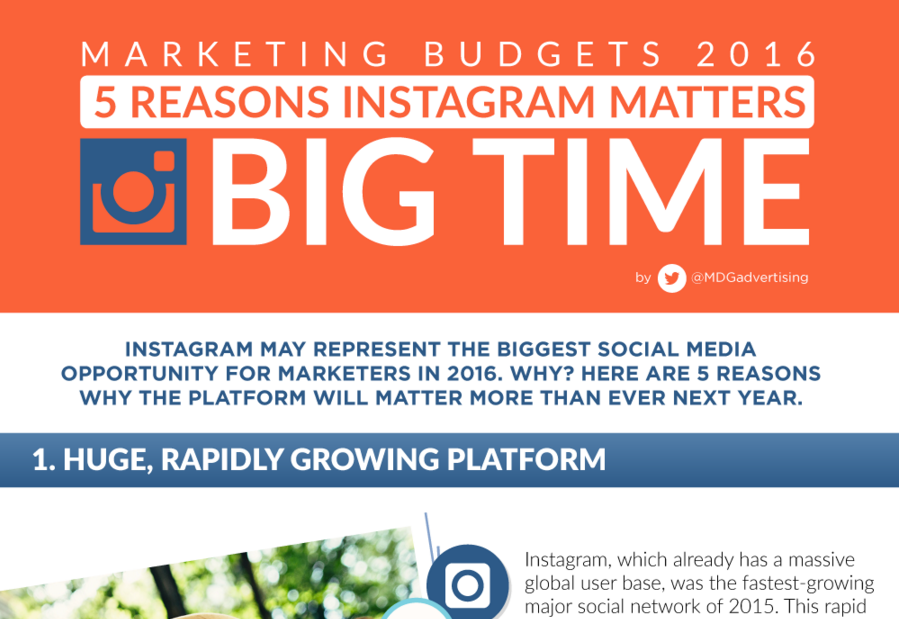
Marketing Budgets 2016: 5 Reasons Instagram Matters Big Time
With more than 400 million active users, Instagram already has a large following. But it is projected to grow another 16 percent in 2016. Local businesses need to decide if this online marketing channel is right for them and capitalize on the opportunities it presents.
––
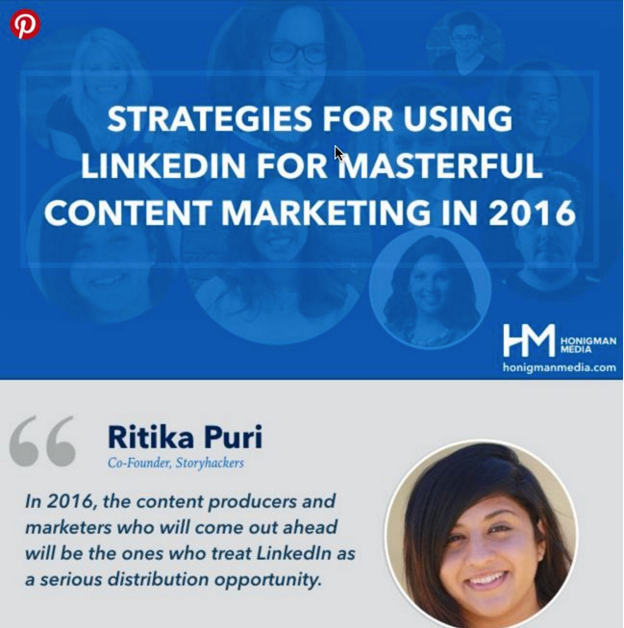
Strategies for Using LinkedIn for Masterful Content Marketing in 2016
Ten LinkedIn experts answered this question: “What’s one way brands can better master content marketing on LinkedIn?” The infographic includes each person’s name, company, and answers.
––
How to Attract Clients You Love Through LinkedIn

How to attract clients you love through LinkedIn.
In this infographic, business coach Melissa Dawn shares her process for using LinkedIn to attract the types of clients with which she wanted to work. The process involves making changes to your profile (to help you stand out), connecting with people on a scheduled basis, and participating by posting and getting involved in groups for at least 30 minutes per day.
––
The State of Email Marketing 2015
Smart Insights and GetResponse surveyed more than 1,800 email marketers from businesses of all sizes and sectors worldwide and created this infographic based on the report, “State of Email Marketing in 2015.” The report looked at items such as email effectiveness, email formats (newsletter and customer surveys), targeting techniques, and managing lists.

