
Ecommerce merchants know it’s important to track sales, customer activities, and marketing campaigns. They can do this in Google Analytics. When it comes to finding actionable insights, however, in almost every case merchants need to be comfortable with the concept of segmentation. There’s no way around it. Aggregate numbers are just not very telling.
Here are three key reports and segmentation ideas for ecommerce merchants.
1. Segment by Traffic Channel
It is important to assess each channel in terms of traffic generation and conversion rate.
Traffic generation numbers can be looked at under the “Traffic Sources” section of Google Analytics. Here, you can monitor how people are coming to your site — through organic or unpaid sources, referral sources, which are outside sources pushing people to your URL, or by those typing in your web address or utilizing a bookmark for direct traffic. It’s important to know where your visitors are coming from and why. By monitoring the sources of your traffic, you are able to see what’s working in your marketing campaigns. You also will benefit from the ability to gauge the point of access from several sources.
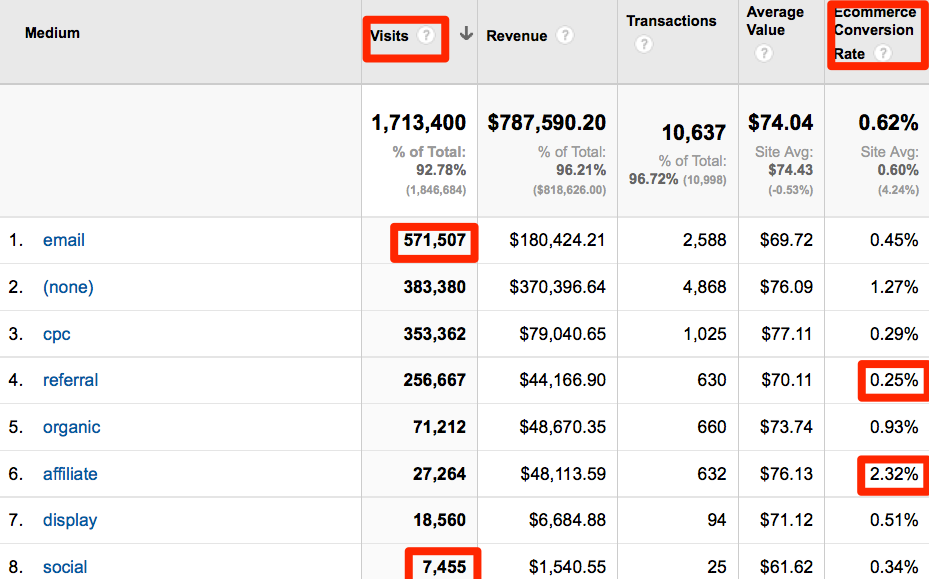
Looking at the example below, this site’s highest traffic generator is “email,” while the least performing source is “social.” The email-marketing manager for this site deserves a raise. The company should continue to expand on this channel and grow its email list. But a great deal of attention should go to social media campaigns. A way needs to be found to drive more response from all these posts, tweets, sponsored stories, and social ads.
Emails are the highest traffic generator in this example. Enlarge This Image
Ecommerce conversion rates can be determined by setting ecommerce tracking to measure the online sales or outcomes. The ultimate conversion for an ecommerce site is when someone makes a purchase.
Let’s say a fictional ecommerce site has had 5 purchases out of 100 visits — a conversion rate of 5 percent. Take that a step further and compare where these customers are coming from by utilizing the Traffic Sources information. Now, you can view the relevant data of both. You can see how customers are coming to your site, and how many are reaching your conversion point. If you have an affiliate program, and receive a lot of traffic from other websites, conversion in this case would be more related to the traffic you’re receiving from your network sites.
As you can see from the chart above, the conversion rate for “affiliate” traffic is doing exceptionally well at 2.32 percent, compared to “referral” traffic, which is converting at 0.25 percent. This information is much more actionable than reporting on the aggregate conversion rate of 0.62 percent.
When tracking conversion rates, it’s important to monitor traffic sources, or conversion events, with very high and very low conversions. If your “Holiday Special” sales have very low numbers, there may be something that’s hindering visitors from making that purchase. This could be an issue with (a) content that’s not as informative as it should be, (b) links that aren’t easily accessible, or (c) your site could be hard to navigate. These are things to consider.
2. Segment by Day of Week
Segmenting by the day of the week is another beneficial report. Let’s revisit our fictional ecommerce site. In the graphic below, Thursday has the highest conversion rate, while Sunday has the lowest. This could be because visitors are placing orders prior to their weekend activities. Or, it may be because the merchant sends his email and runs his weekly web specials on Thursdays. Track where visitors are coming from and see why conversion rates are what they are, and then amplify the successes.
Analytics data needs to be segmented. Enlarge This Image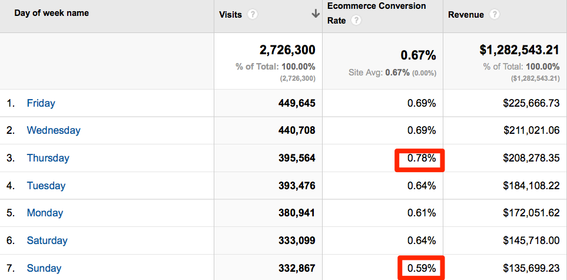
Set up custom reports by clicking here after logging in to your Google account.
You can segment further by hours within the day for a more precise view of visitor conversion. As seen in the graphic below, Hours 13 and 14 — which we can assume are 1 p.m. and 2 p.m., respectively — are peak conversion times.
Further segmentation can reveal beneficial data. Enlarge This Image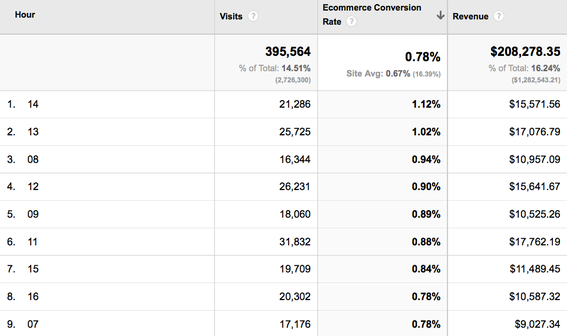
3. Funnel Segments
Segmentation is not just for traffic channels, visitor type, or day of week. The concept can be applicable to many other aspects of your ecommerce site. When we think of shopping cart funnels, many organizations create and report on one funnel: the process starting at the “Add-to-Cart” step and ending at the “Checkout Complete” step.
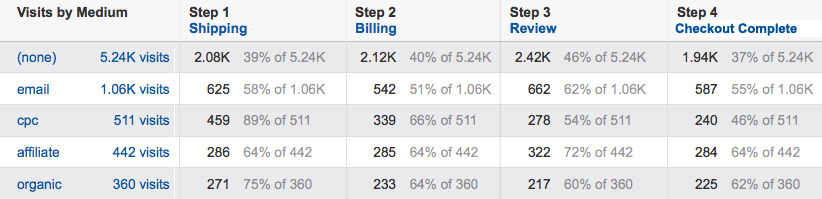
While this basic funnel is helpful, true gems are found when you zoom in and look closer at the entire checkout process. You can review the completion percentage of every step of your funnel by the traffic channel. To do that, go to the Conversions > Goal Flow Reports, then select “Medium” in the dimension drop down. You can see the performance of your traffic every step of the way.
Close up views of conversion funnels can show you where the funnel is working best. Enlarge This Image
Other Conversion Funnels
Are there other funnel ideas? Of course. Here are some useful ones to consider.
- Add-to-cart conversions. Think of the “Add-to-Cart” step as a micro-conversion and set it up as a Google Analytics goal to track campaign response and “conversions.” Which channels and campaigns are generating enough interest for people to add products to the cart?
- Track repeat buyers. Identify “repeat buyers” in Google Analytics. Then create a funnel for this valuable set of visitors and monitor conversion rates, average order values, and overall shopping behavior. A parallel exercise would be to analyze the same metrics for first time buyers. You’ll likely see a different behavior between the two types of visitors; you’ll have two distinct benchmarks to trend and improve upon.
- Location of add-to-cart. On many ecommerce sites, the main product page is not the sole source of adding to cart. You might have a promotion page, or a home page banner with add-to-cart capabilities. Measuring where products are added from is something to consider.
- Guests vs. registered users. If you have different paths into your shopping cart, one with a required login and one without, set up a funnel to measure the impact of these steps on your overall conversion.
Conclusion
There are three reports in Google Analytics that can tell you a lot about your visitors and transactions. With “Traffic Sources” data, you can see where visitors are coming from, and which sources work best. Roll this information into ecommerce reports and conversions and you have a better overview into specific days and even times in which conversions are happening. Finally, by creating custom funnels, you can develop a handful of reports that provide insights into your visitors’ shopping experiences and potential bottlenecks.

