In April 2016, Google Analytics launched a new report called “User Explorer.” It allows you to see individual user behavior and interactions with your website. Each interaction is in order of occurrence and is date and time stamped.
To locate the User Explorer report:
- Login to Google Analytics.
- In the top menu, select the Reporting tab.
- In the side menu, expand Audience > User Explorer.
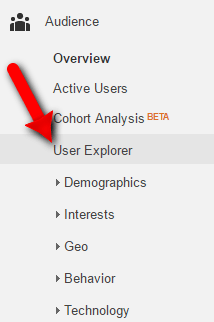
In the side menu of the Reporting tab, expand Audience > User Explorer
Benefits of User Explorer Report
Prior to the User Explorer report, you needed session recording software, such as Clicktale or Mouseflow, to see this level of detail. While the report doesn’t replace that software, it does provide a detailed-level of insight.
Below is what you initially see when you view the report. Client IDs are on the left side. Each client ID represents an anonymous, unique identifier that is associated with a user. On the right is the number of sessions generated by the users. On the far right are three columns of data that show:
- Revenue generated;
- Number of transactions;
- Goal conversion rate for that user.
The report is pre-sorted by the number of sessions in descending order. You can change the sort order of the report by clicking on the column heading. My preference is to view the report by number of transactions or goal-conversion rate in descending order so that I can see the highest valued users at the top.
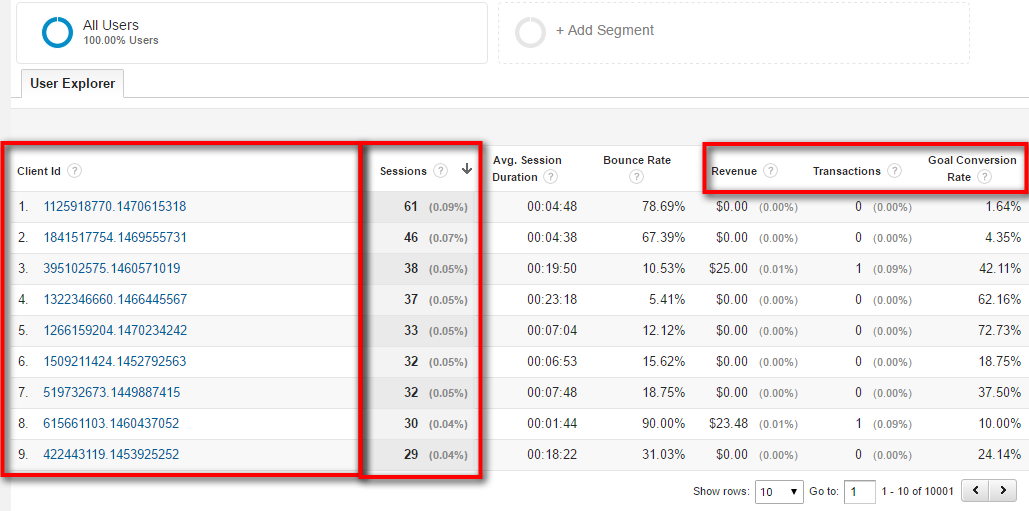
This User Explorer report is sorted by the number of sessions in descending order. Click image to enlarge.
Most Google Analytics reports provide data at an aggregate level. But analyzing data at the individual level can provide amazing insights. For example, you can troubleshoot an issue within your shopping cart journey or checkout page.
To do this, I’ll segment the users that dropped off in the “Review” step and did not complete a purchase.
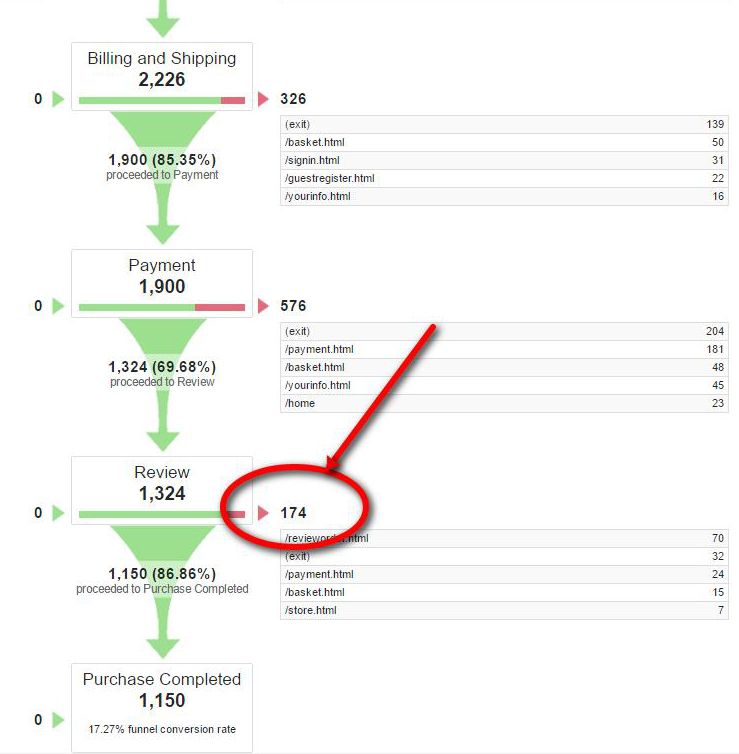
In this example, 174 users dropped off in the “Review” step of checking out.
To apply a segment to the User Explorer report, click on “Add Segment” above the report. Next, define a custom segment, to filter all sessions that viewed the “revieworder.html” page and did not complete the purchase goal.
- Give the segment a name. I’ll use “Purchase Not Completed” for this example.
- Change the dimension to “Page.” Set the condition to “matches regex.” Enter the page name in the textbox for the review order page.
- Select the “Purchase Completed (Goal 1 Completions)” and set this equal to 0.
- Click “Save.”
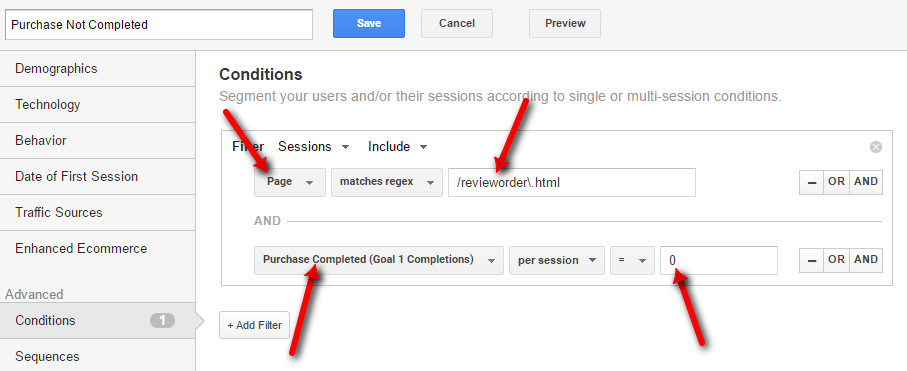
Segment the User Explorer report to see specifics of user drop off. Click image to enlarge.
After applying the segment to the report, you will see the list of Client IDs that viewed the “revieworder.html” page and did not complete the purchase goal. Applying segments is essential for benefitting from the User Explorer’ report. It’s unreasonable to think you can review each and every user interaction. Segments can filter the data that you really need to analyze.
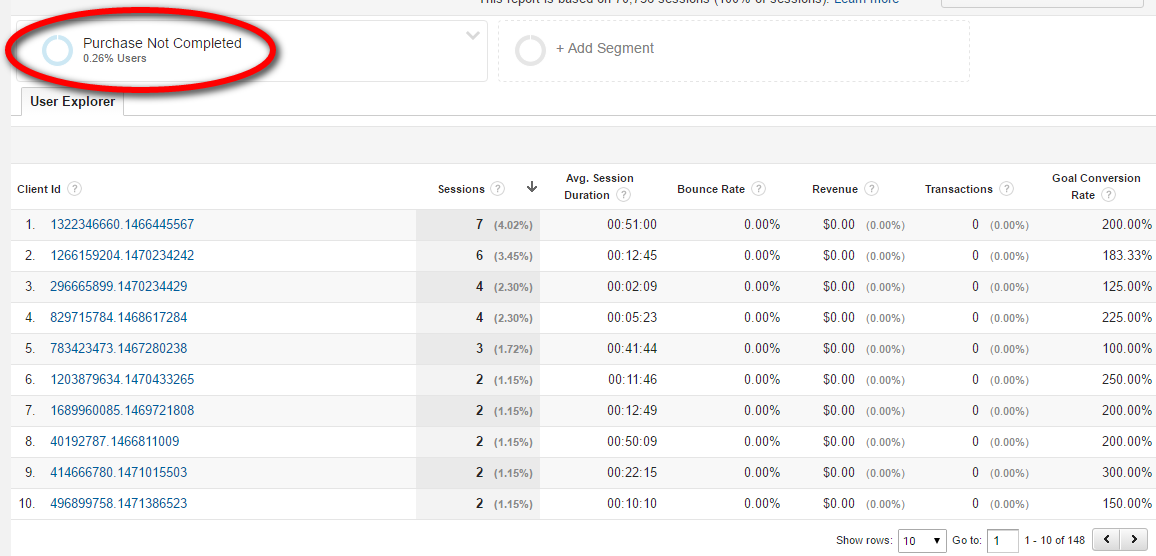
Once you segment the report, you will see a list of Client IDs that did not complete the purchase. Click image to enlarge.
User Report
When you click any Client ID on the report, you will see the details for that user. Near the top are the total number of sessions, average session duration, and revenue. On the left, are the acquisition date and acquisition channel. This represents when the user first visited your site and by what channel — organic search, direct, and so on.
Lastly, it will list the device type of the user — desktop, mobile, tablet. The nitty-gritty of this report is the wide, detailed section showing each session and the interactions within those sessions. You can expand each session by clicking on it or clicking “Expand All.”
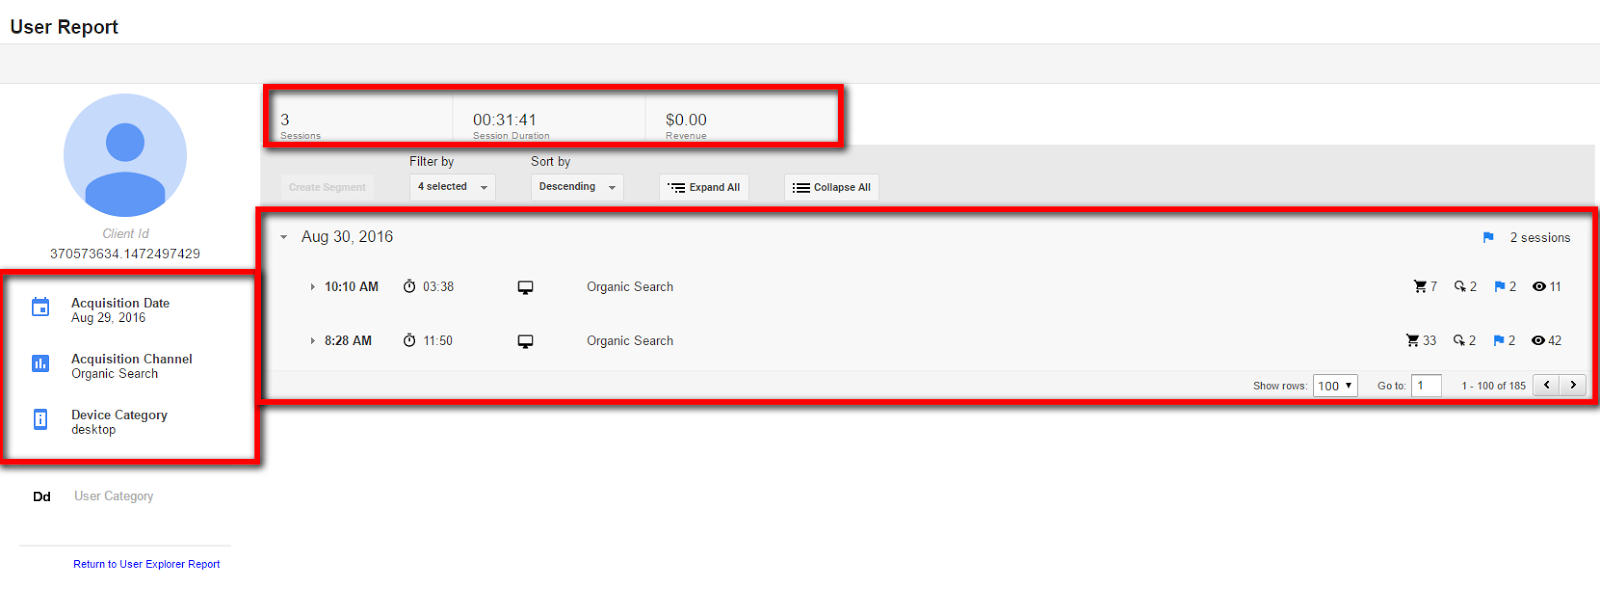
The User Report shows total number of sessions, average duration, and revenue. Click image to enlarge.
Interactions
Below is the detailed report of interactions in descending order.
- Page view interaction: View the page title and URL.
- Goal interaction: View the goal name.
- Ecommerce interaction for a checkout: View the product code and product name.
You can filter this report by different types of interactions (e-commerce, sessions, goals, and pageviews). You can change the sort order. Near the top and on the right, it lists the total number of interaction for each type (e-commerce, sessions, goals, and pageviews).
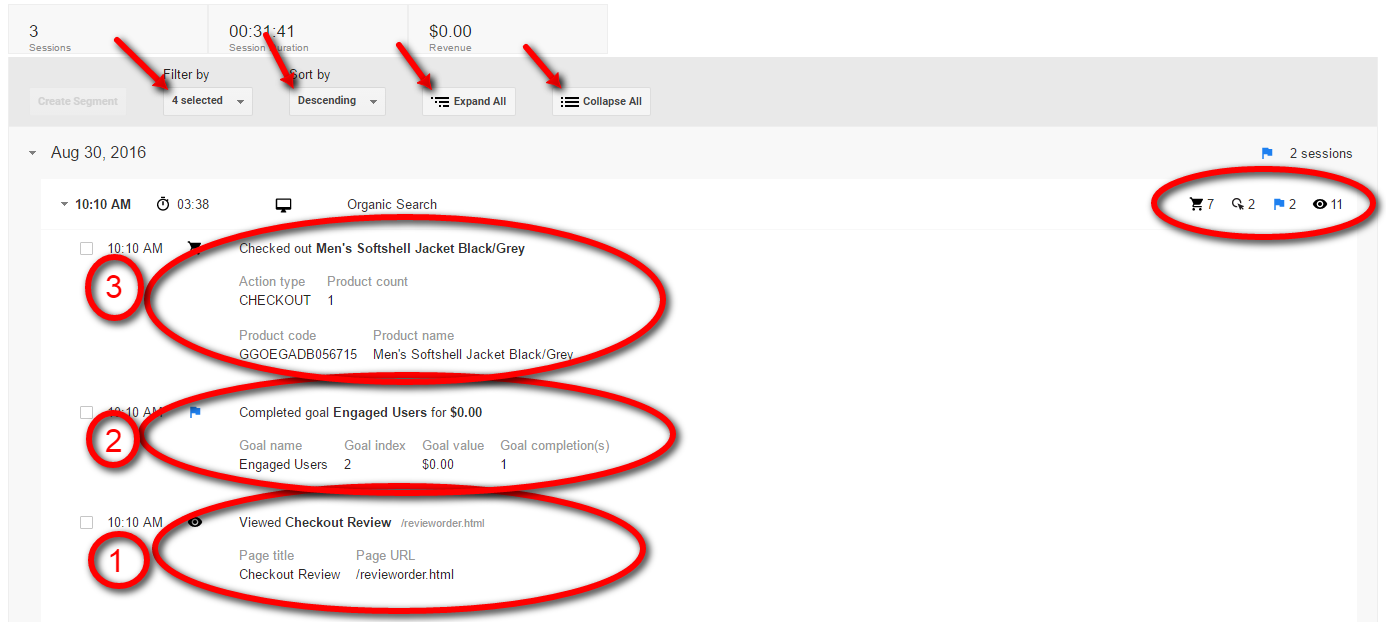
A detailed report of interactions in descending order. Click image to enlarge.
User ID
If you enabled the User ID view on Google Analytics, you will see User IDs listed for each user in the “User Explorer” report in the User ID view.
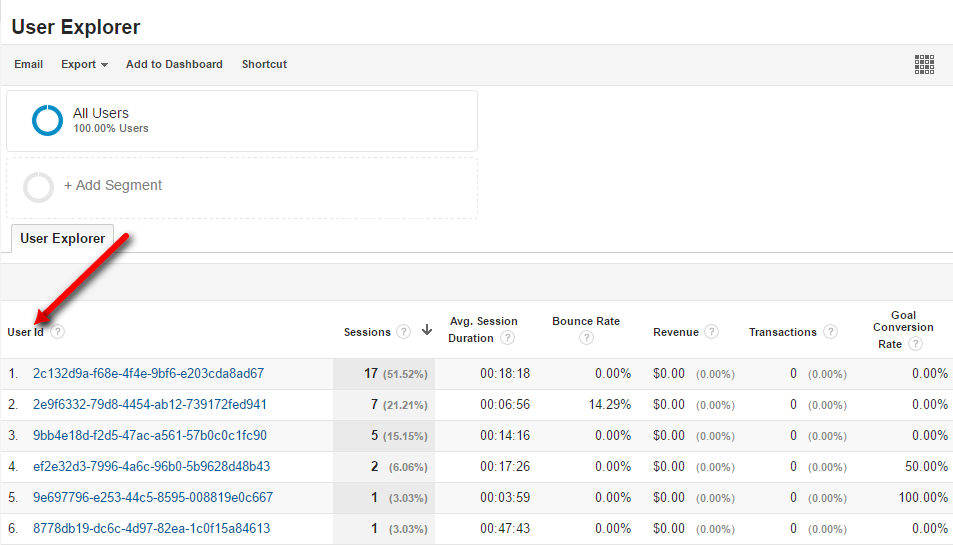
If enabled, User ID view will show IDs listed for each user in the User Explorer report. Click image to enlarge.
The biggest advantage of viewing the User Explorer report by User ID is that you can view the user engagement across devices and browsers.
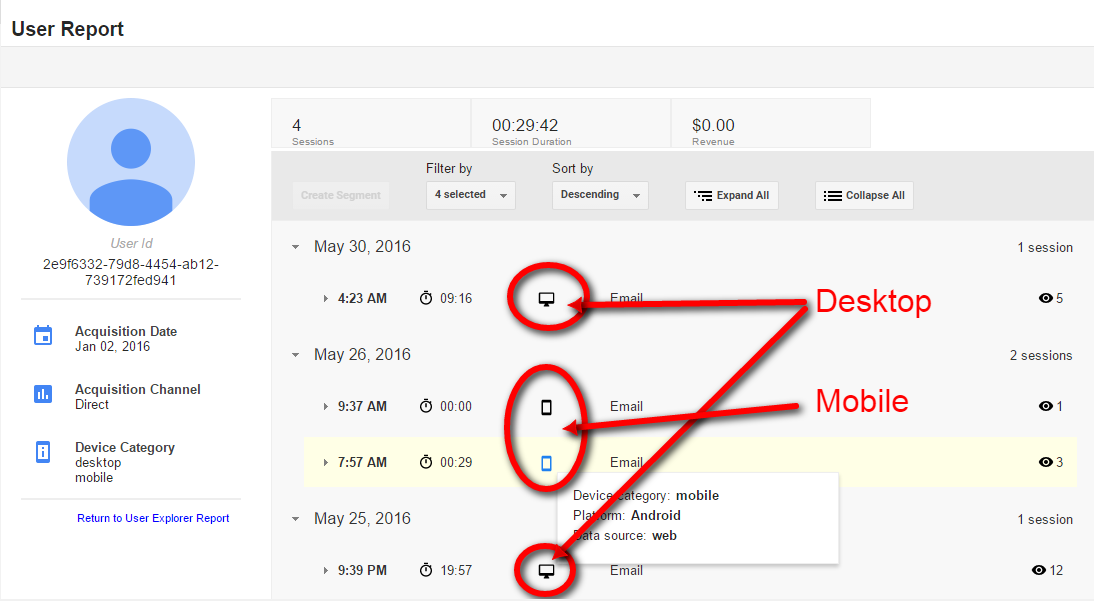
The User Explorer report makes it easy to view engagement across devices. Click image to enlarge.
Final Thoughts
The User Explorer report is an big leap forward for companies using free Google Analytics. Those using Google Analytics 360 (formerly known as Google Analytics Premium) have additional options. They can enable BigQuery to export this data, which gives seemingly unlimited options.