In May 2011, Google launched a new version of Analytics. This new version 5 is good news for power users, as it makes many of the advanced features Google has been developing over the past few years more accessible. If you still feel a bit overwhelmed with the range of options that Google Analytics offers, v5 will require some adjustment as you transition to the new, more powerful interface.
In this article, I’ll explain what has changed in Google Analytics and how you can more easily make the transition to the new version.
When You First Log In
In the old version of Google Analytics, the login page was a snapshot of your user accounts. The login page was a master dashboard of sorts, showing some of key metrics, such as Visits, Avg. Time on Site, and Bounce Rate.
The current (old) login page provides a snapshot of site activity.
You can keep using the current version of Analytics as your default. If you are ready to jump into the new interface, you can access v5 by clicking the New Version link at the top of the Analytics page.
Access the new version via the link at the top of the page.
The new main screen is a list of accounts and profiles. You will no longer see a snapshot of your site’s activity. You will have access to all your profiles.
The new page. Be aware of these useful icons.
Key icon-links to be aware of include the following.
-
Tool icon. At the top right of the screen is a tool icon that gives you access to your main settings for each account. This is a critical page for managing your accounts and one that you might not easily find.
-
Four report icons. Google has created four icons for you to access popular reports. One of these — the “visitors” icon — will take you into the “My Site” page, which more or less corresponds to the general data you saw when you first went into a profile in the old version of Analytics.
The Primary v5 Tabs
Google’s intention with the new version is to facilitate a much more powerful user experience. The tabbed interface emphasizes the areas Google presumably wants you to start using.
V5 has powerful new tabs.
-
Dashboards. Google has given you the flexibility to create as many dashboards as you like. Each dashboard can contain multiple configurable widgets to give you granular control over the key data you want to monitor. If you are a small organization, creating one customized dashboard with your key reports will likely satisfy you. A good place to start with this new feature is by setting up a few of your own custom widgets and seeing some of the configuration options that are available.
-
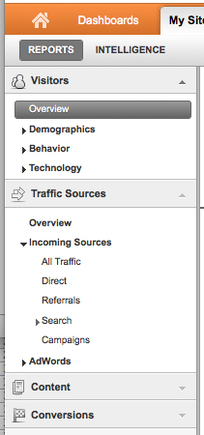
My Site. The “My Site” tab takes you into your basic reports, which you are likely familiar. Some of the names of the reports have been changed, but you should be on familiar ground as you click through the navigation on the left side of the page.

Access your basic reports through the "My Site" tab.
The “Intelligence” sub-tab is nothing new. It is one of many helpful features that Google rolled out in the past year and a half. Analytics v5 now emphasizes this feature. With “Intelligence Events,” you can specify activities and associated threshold levels that will trigger alerts. A simple example is that you can set an alert to notify you if your daily site traffic drops below a certain number of visitors.
-
My Conversions. Google continually emphasizes the importance of gaining actionable insights from your data. It has focused on these goals in the new version.
If you were already using goals, much of the goal configuration will be familiar to you. One nifty enhancement for power users is the ability to configure and track events as goals. For example, you could designate as a successful goal a user going to a particular page and watching a video.
-
Custom Reports. Custom reporting is not new in Google Analytics. With v5, however, custom reports have been given top status.

Create powerful custom reports to examine specialized data.
The idea behind custom reports is powerful: You can create permanent filters and drill-downs, based on the information that is crucial to your organization. If you often perform the same repetitive series of clicks in Analytics to find the data you are looking for, you could likely configure a custom report that will be immediately available for you and save you time.
Other Key Enhancements
“Page Speed” report. The Page Speed report was available before v5. But it is a key one, as Google has put importance on page speed and now allows you to track your site’s page speed metrics from within Analytics. For more on page speed and how it impacts your site’s search engine visibility, see “How to Increase Page Speed and Help Search Engine Rankings,” my previous article on that topic.
New Overview Reports. Overview reports have always been the primary window into your data. They still exist in v5, with some new flexibility built in. For more on this topic, see “New Google Analytics – Overview Reports Overview,” a post on Google Analytics Blog.
Conclusion
The Google Analytics Version 5 release incorporates improvements that the Google team has rolled out over the past few years. If you have not yet used customization and intelligence features in Google Analytics, then v5 might not help you.
But the new release does pave the way for long-term development of Google Analytics into a more intelligent tool for business owners to make sense of their web traffic. Now could be a great time for you to jump in and see all that Google Analytics has to offer.


