Niche ecommerce merchants face challenges in competing with big box retailers. Providing an online shopping experience on a tight budget that is comparable to the larger sites (with huge budgets) can seem insurmountable.
A top priority for a niche merchant in improving the user experience is page load times. Fortunately, Google Analytics has a reporting suite on load times, at “Behavior > Site Speed” in the left-hand menu.
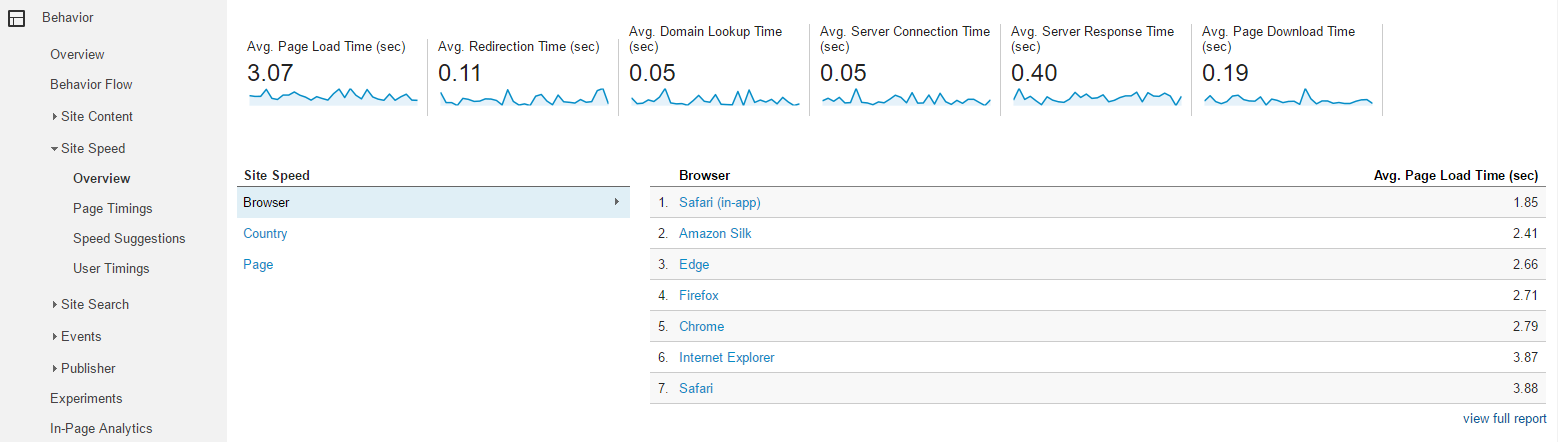
Look for page load time reports under “Behavior > Site Speed” in the left-hand menu. Click image to enlarge.
The Overview report will provide an overall page load time, followed by several other timing metrics. Here are their abbreviated definitions, with my observations.
Avg. Page Load Time (sec). This shows the overall time it takes for the entire page to load. This is where you start. Your target should be under 3 seconds. 3 to 5 seconds is marginal. Over 5 seconds is cause for concern. Over 10 seconds is unacceptable.
Avg. Redirection Time (sec). If you have redirects on your site, such as 301 redirects, this value will be greater than 0. Any value greater than 0.5 seconds would be cause for concern.
Avg. Domain Lookup Time (sec). The amount of time spent in DNS lookup for the page is reported here. If your average is greater than 0.25 seconds, take action.
Avg. Server Connection Time (sec). This reports the amount of time the average user spent connecting to your server. Any time over 0.25 seconds is cause for concern.
Avg. Server Response Time (sec). This metric reports the average time to respond to a user request. Any time over 0.25 seconds should be investigated.
Avg. Page Download Time (sec). This shows the average time to download your page. A time over 2 seconds means there is opportunity for improvement.
The full definitions and details are at Google help documents, including a diagram of the page timing components.
The “Page Timings” report by Browser is helpful to begin your analysis. You can get to this report via the “View Full Report” link in the “Overview” report.
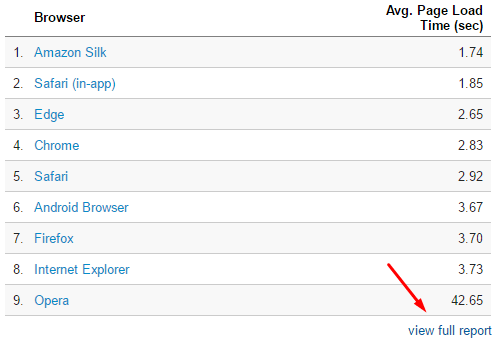
Get to the “Page Timings” report via the “View Full Report” link in the “Overview” report.
Select “Data” view and Secondary Dimension by “Device Category” to view a report similar to the one I will be commenting on.

Select “Data” view and Secondary Dimension by “Device Category.” Click image to enlarge.
I like to sort by “Avg. Page Load Time (sec)” in descending order to identify the highest page load times by Browser and Device Category.

Sort by “Avg. Page Load Time (sec) in descending order to identify the highest page load times. Click image to enlarge.
I can now identify the types of users with the highest load times. Safari for Tablet has the highest page load time for this example merchant, followed by Amazon Silk for Tablet and Edge for Desktop.
Always consider the number of “Pageviews” for each sample. If page views are low, there may not be enough justification to address that particular page, browser, or device. In the example above, Amazon Silk for Tablet only had 480 page views, representing just 0.21 percent for the entire site.
If you see one or more browsers having high page load times, your website may have elements or scripts that are not supported by those browsers.
Do you see one Device Category impacted by page load time? If yes, that would be the device category to focus on. Here’s an example of a merchant that has an issue primarily with Mobile.
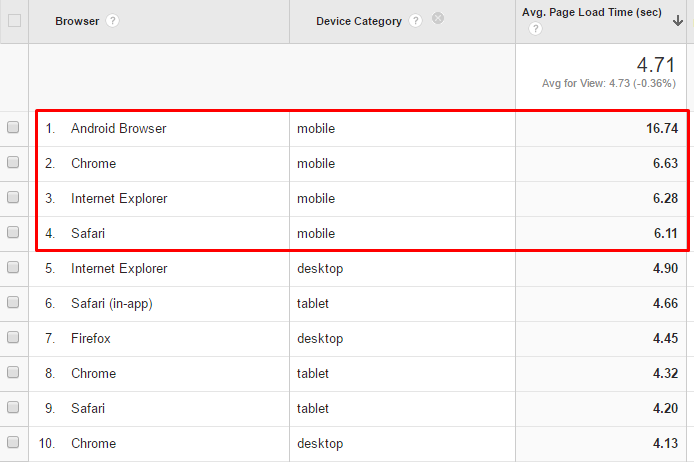
In this example, a merchant has an issue with mobile load times.
The opportunity for this merchant is to address page load timing issues on its mobile site.
After investigating high-level page load timing issues by Browser or Device, it is time to focus on specific pages. The “Page Timings” report will list each of your pages and their Average Page Load Time. I prefer the “Data” view when I run this report. Also, since I am looking for the worst performing pages, I sort by “Avg. Page Load Time (sec)” in descending order and filter by “Pageviews > 100” to remove any pages that didn’t have many Pageviews.
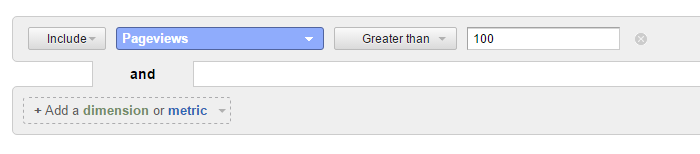
Filter by “Pageviews > 100” to remove any pages that didn’t have many Pageviews.
The key metric to determine if you should improve a page’s load time is the “% Exit rate.” If Page Load Time is higher than average and % Exit rate is also higher than average, users are likely exiting that page due to the load time.
In the example above, almost all pages in the top 10 take 3-times longer to load than the 3.06 second average and almost all have a % Exit rate 2-times greater than the site average of 26.6 percent. I would focus on those pages for optimization.
Google provides actionable feedback for optimizing page load times in the “Speed Suggestions” report.

Google provides feedback for optimizing Page Load Timing in the “Speed Suggestions” report. Click image to enlarge.
“Page Speed Suggestions” is one of the columns of the report. Click on the hyperlinked text to get detailed recommendations for improving Page Load Time. The “PageSpeed Score” — a scale of 0 to 100, with 100 being perfect — provides a metric for improving.
When you click on the hyperlinked text under the “PageSpeed Suggestions” column, a report similar to the screenshot below will display. I clicked on the “Should Fix” suggestions to show examples.
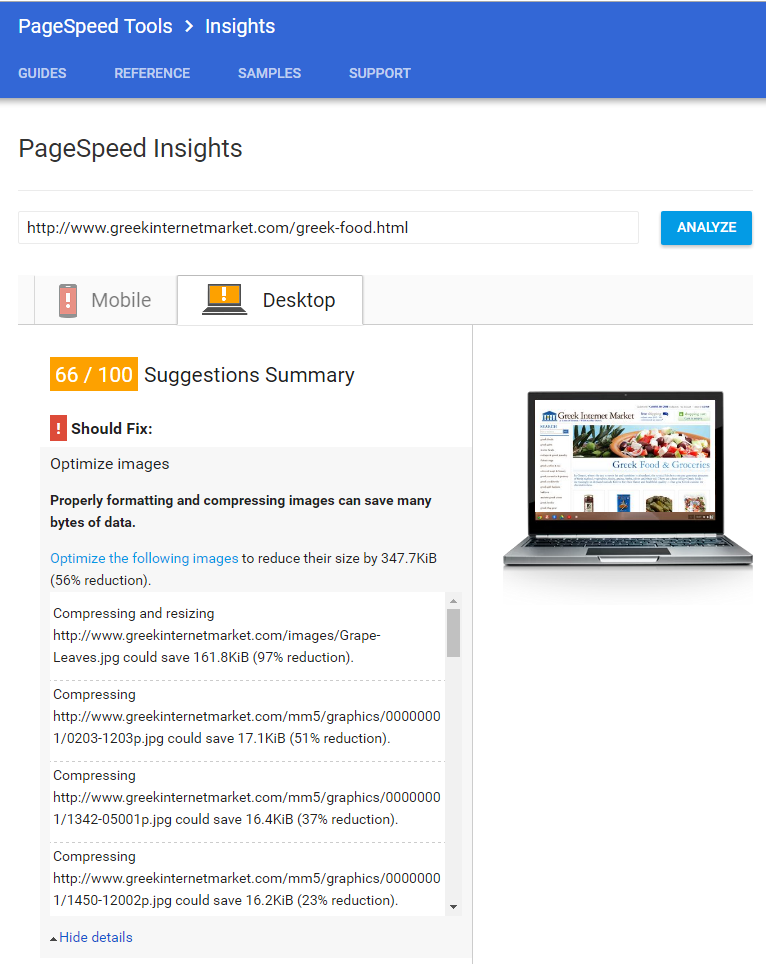
Under the “PageSpeed Suggestions” column, a “Should Fix” report provides suggestions of key issues to address.
Most of the opportunities in this example are to compress images to reduce their file size. Look for common themes across pages and also across devices — mobile vs. desktop— that will give you the biggest bang for your buck. There may be tracking scripts or other elements on all pages that can be optimized.
The final reporting section in the Site Speed reports is called “User Timings.” To get data in this report, define specific elements to be measured for load times. This is quite advanced and may not warrant your time.
I saw the biggest improvements in load times when I made the following updates to my niche ecommerce site.
- Switching to a better hosting company. I was hosted by a cheap (low cost) host. But it was not serving up my site quickly. When I switched to the company that provides our shopping cart software, our page load times were cut in half, roughly, and our conversion rates more than doubled. The extra cost of the better host was immediately justified.
- Building a dedicated mobile site. After our mobile site went live, page load times for mobile were cut in half and conversion rates (for mobile) doubled. We paid for our mobile site within months with the added revenue.
There is much more to explore in the Site Speed reports in Google Analytics. Use this actionable data to improve page load times — and compete with the big box merchants.