Ecommerce merchants need easily accessible data to make quick decisions and drive more sales. But the data used by merchants differs based on their particular circumstance. They need data that is customized to their situation.
In this article, I’ll explain how to assemble Google Analytics’ custom reports, shortcuts, and dashboards. I’ll also address Google Data Studio for enhanced dashboard reporting.
Custom Reports
Google Analytics’ default reports in the main reporting interface have a lot of helpful data. But that data can be overwhelming. Essential metrics can be scattered throughout several reports or tabs.
You can, however, build a custom report to assemble the data just the way you want it. To do this, use the “Customize” button in most reports. For this example, I will go to the “Acquisition > All Traffic > Source/Medium” report.
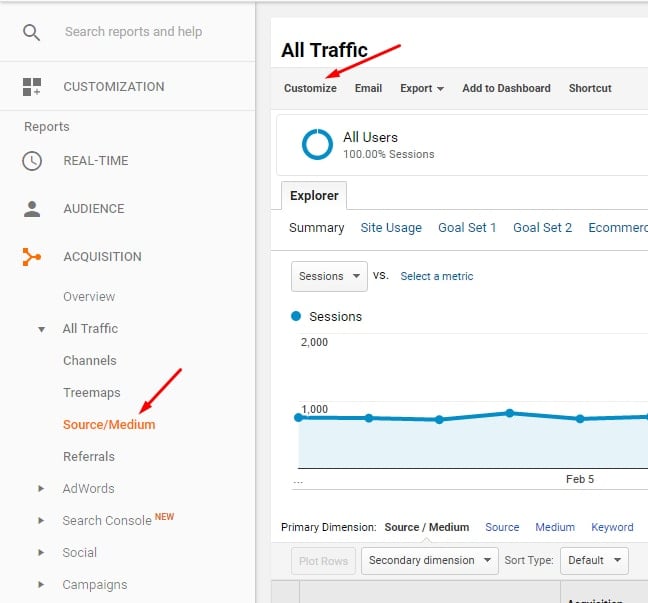
Viewing the “Customize” button in a report.
Note the “Customize” button in the top-left of the report page. Click on it to show how the report was constructed. You can remove metrics by clicking on the “x” symbols next to them, or add metrics if space allows. Rename the title to whatever suites you.
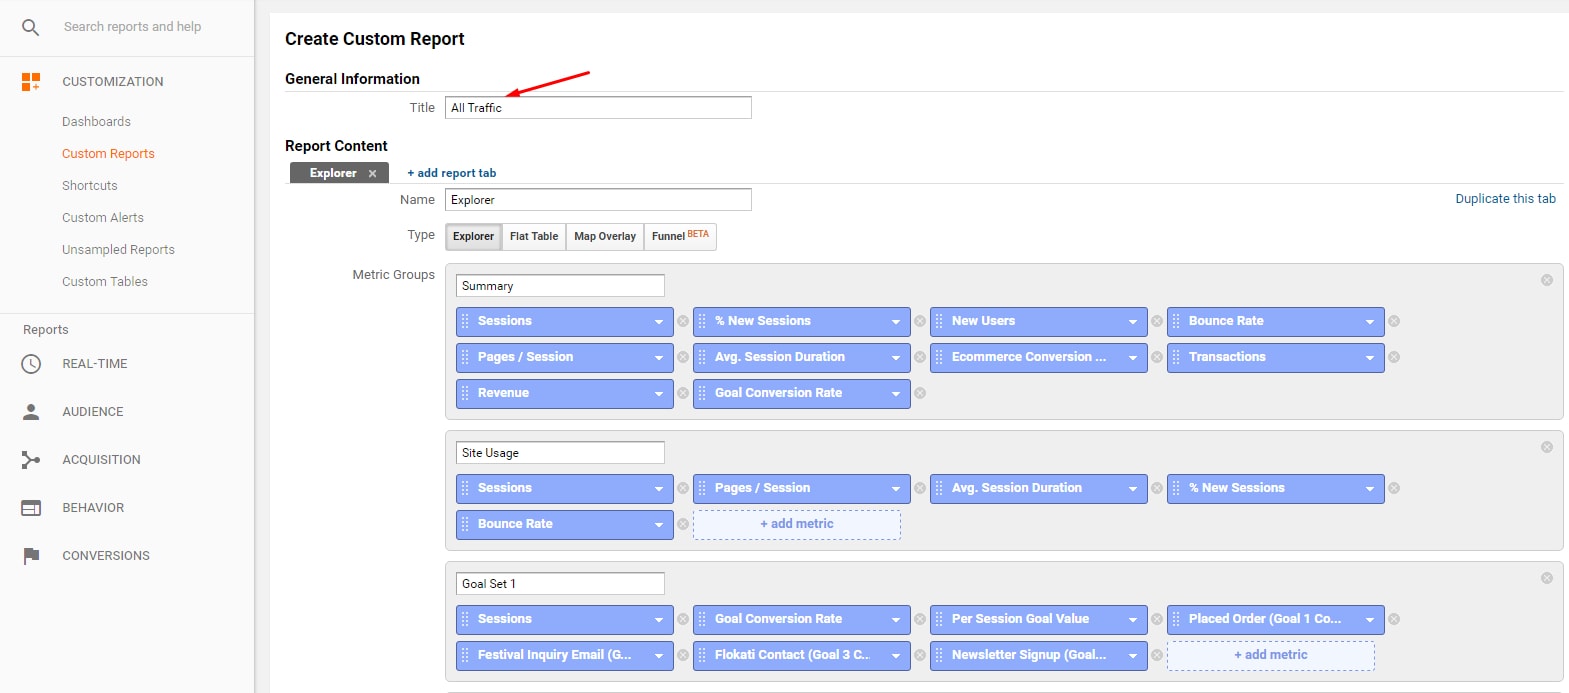
Rename the custom report and add or remove desired metrics. Click image to enlarge.
Modify the dimensions as you like. Add more dimensions to allow for a deeper drill-down, such as “Campaign” and “Keyword” for the “Source/Medium” report.
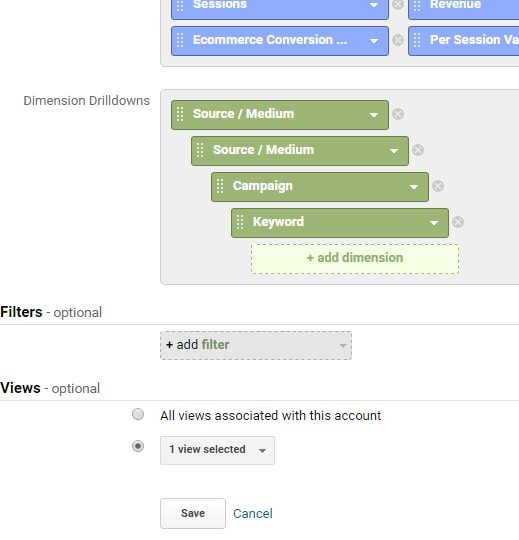
Modify the dimensions to allow for a deeper drill-down, as necessary.
If you do not want to drill down to each of these Dimensions, change the report type from “Explorer” to “Flat Table,” but beware as the rows of data will be much larger.
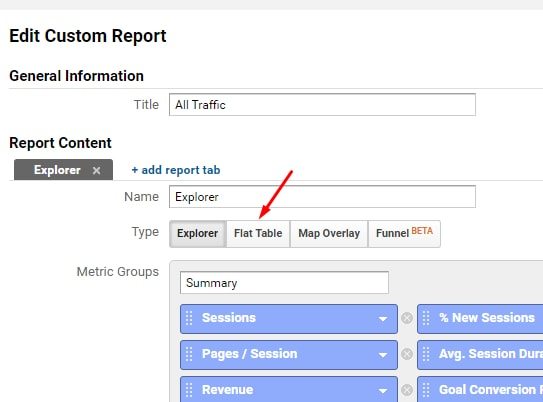
Change the report type to “Flat Table” to avoid drilling down into each dimension.
Finally, if you want to report only certain traffic, enter a filtering rule. In the example below, I report only “cpc” traffic as a medium.
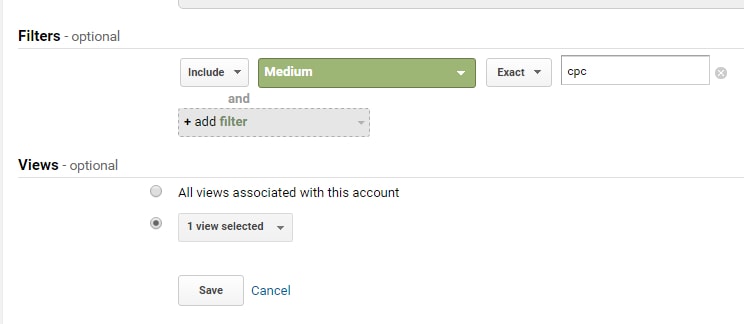
Create a filter for the custom report and select the views that have access. Click image to enlarge.
If you have multiple views that you would like this report to be available in, select them in the “Views” section. Finally, save the report.
To modify the custom report, click the “Edit” link in the top-left above the report.
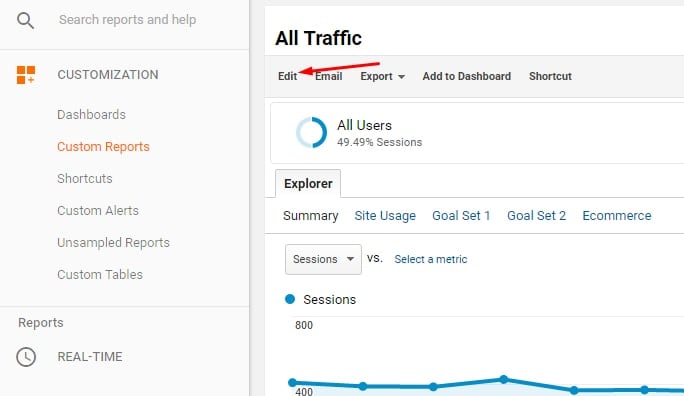
Click the “Edit” link above a custom report to modify it.
Accessing Custom Reports
Custom reports can be found in the “Customization” section on the left side of Google Analytics.
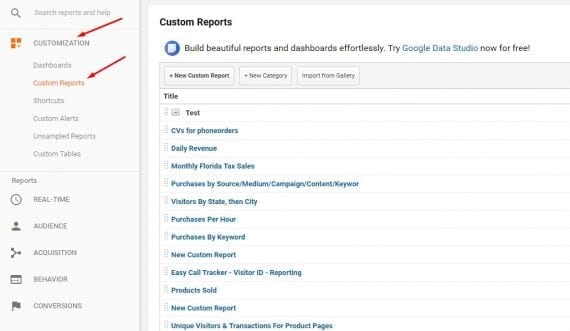
Access custom reports in the “Customization” section.
Shortcuts
Shortcuts take custom reports to the next level. You can create shortcuts that include standard reports or custom reports. You can also include advanced segments and other modifications to the reports and the shortcut will load just the way you saved it.
I will use the “All Traffic” report example I used in the custom reports section to show what you can do with shortcuts. To report only mobile traffic in this shortcut, I clicked on the “All Users” box at the top of the report. This opens the advanced segments options. I went to the “System” tab and selected “Mobile Traffic” (and unchecked “All Users”) and clicked “Apply.”
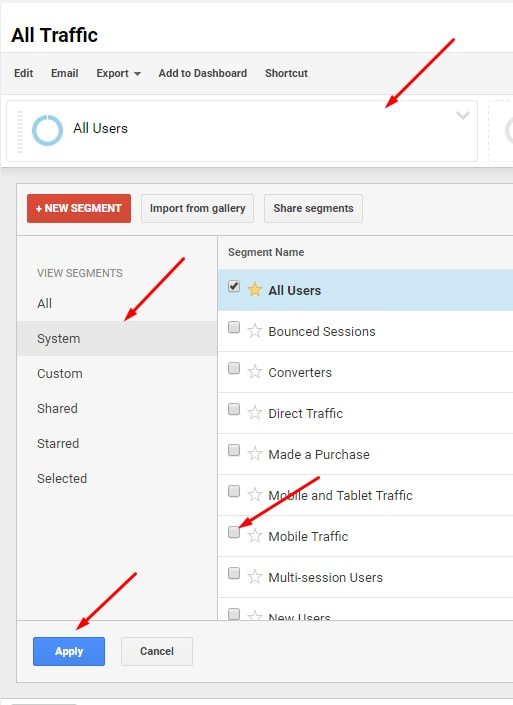
Applying the “Mobile Traffic” advanced segment to the custom report.
Now, I viewed the report and noticed an old source of traffic (“msn/cpc”) that I didn’t want. To get rid of it, I clicked on the “advanced” link next to the report filter.
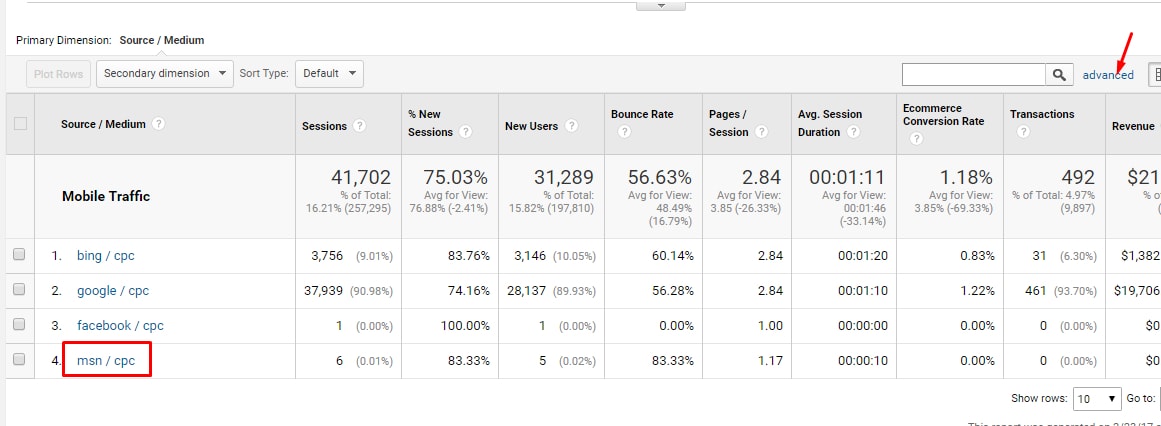
Click the “advanced” link next to the report filter to eliminate reporting on specific traffic sources. Click image to enlarge.
And I selected “Exclude” as the filter rule and entered “msn” in the filter form, then clicked “Apply.”
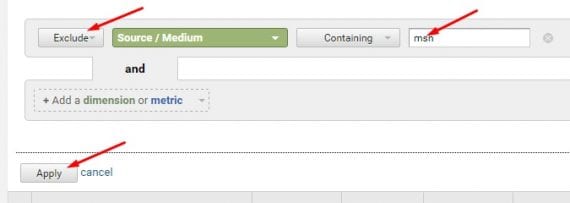
Select “Exclude” as a filter and enter what you would like to eliminate.
I could even sort the output by one of the metrics, such as “Ecommerce Conversion Rate.”

Sorting by “Ecommerce Conversion Rate.” Click image to enlarge.
This report is exactly the way I want it and I want to access it quickly on a regular basis. Saving it as a shortcut will do that.
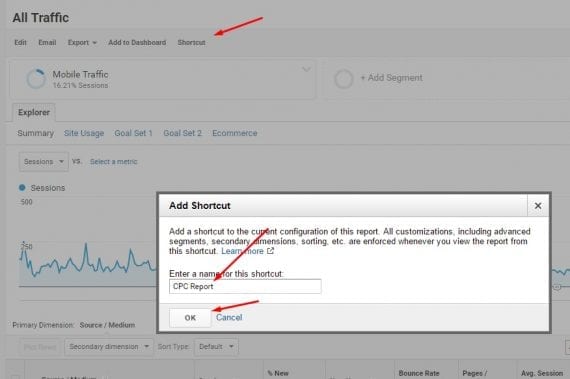
Save the report as a shortcut to access it quickly on a regular basis.
Click on “Shortcut” at the top of the report. Give it a descriptive name and click “OK.”
You can access all shortcuts in the “Customization > Shortcuts” reporting area.
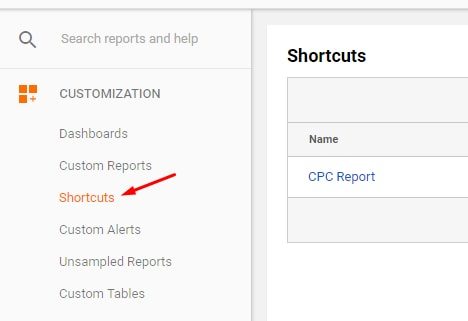
Find all shortcuts by clicking the “Shortcuts” link.
Dashboards
If you want several reports in one page, a dashboard is a good solution. To create a dashboard that contains the shortcut I just created, I would click on the “Add to Dashboard” link at the top of the shortcut. To create a new dashboard, select “New Dashboard,” give it a descriptive name and click on the widgets you would like to include. Finally, click on “Add to Dashboard.”
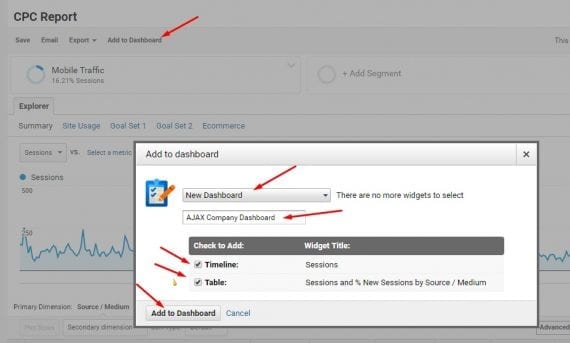
Click on the “Add to Dashboard” link at the top of the shortcut.
Note the widget(s) applied to the dashboard. You can click on the hyperlinked title of any widget to go to the full report.
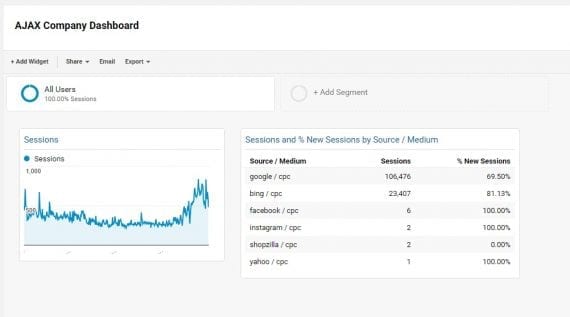
Dashboard view in Google Analytics.
Access your dashboards in the “Customization > Dashboards” reporting on the left side of Google Analytics.
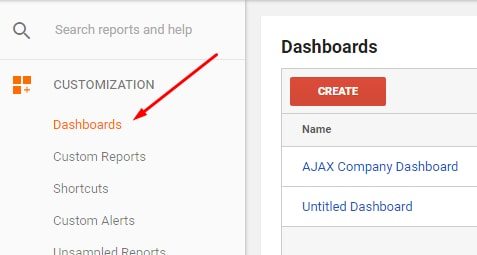
You can find Dashboards in “Customization > Dashboards.”
Google Data Studio
To take dashboards and data visualization to the next level and incorporate data from outside of Google Analytics, Google Data Studio is an excellent platform. It’s free.
Once you have access to Data Studio, try one of the templates.
I chose the “ACME” template for this example. Click on the template you like and click on “File > Make a copy… .”
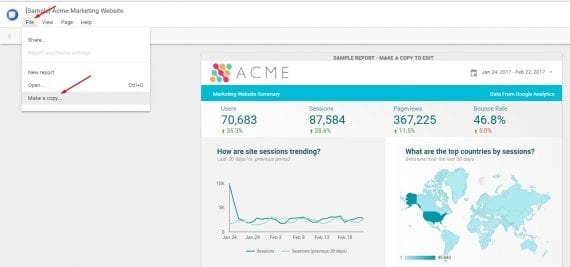
Click on a template you like can click “File > Make a copy… .”
Apply your Google Analytics data to the report by clicking on “Create New Data Source” on the right side.
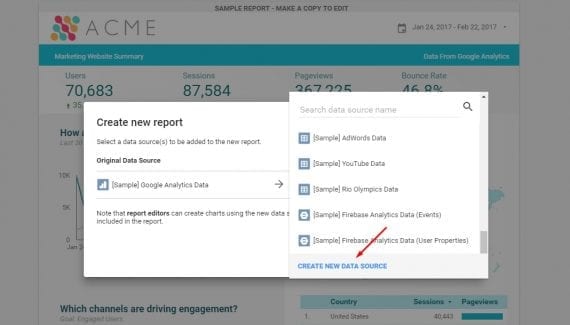
Apply your data by clicking “Create New Data Source.”
Select “Google Analytics” on the data source selector page, then find your Google Analytics account, property, and view and select “Connect.”
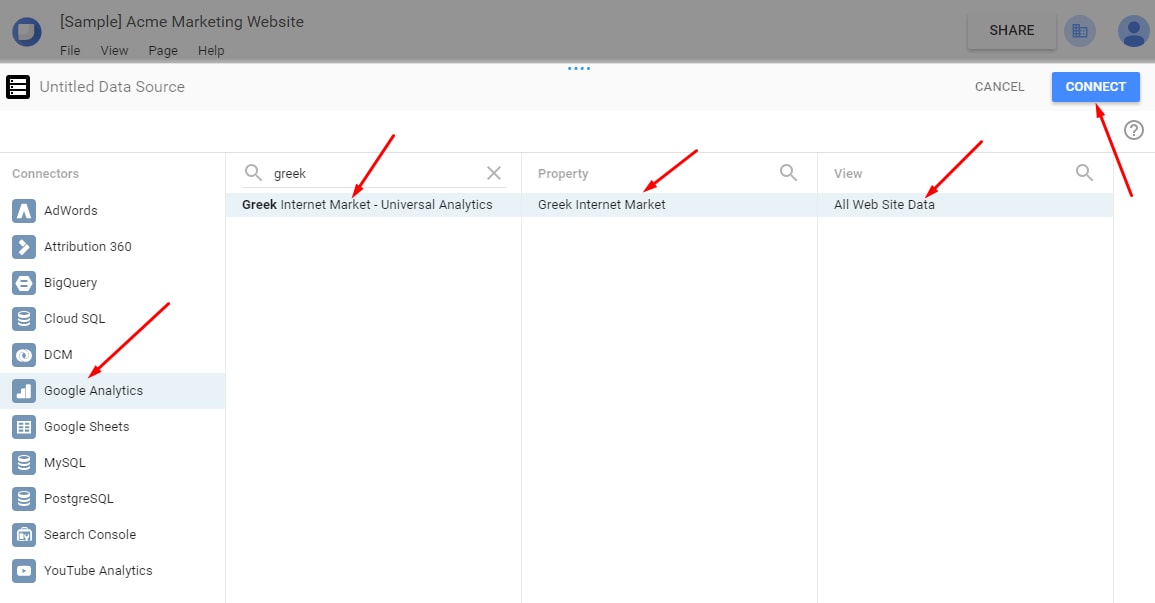
Select “Google Analytics” and find your account, property, and view. Click image to enlarge.
On the next page, you will see many dimensions and metrics. These are available for the report. Click the “Add to Report” button.
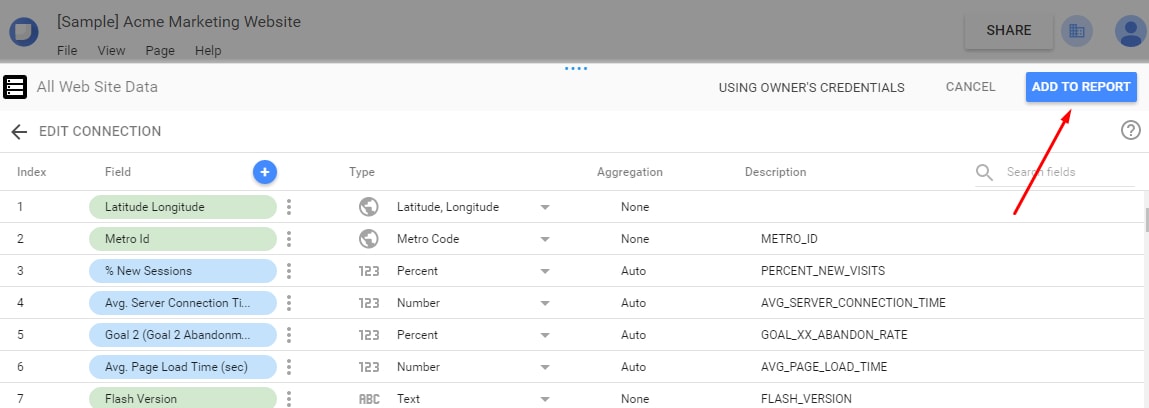
If the dimensions and metrics appear correctly, click “Add to Report.” Click image to enlarge.
Then, on the next page, click the “Create Report” button.
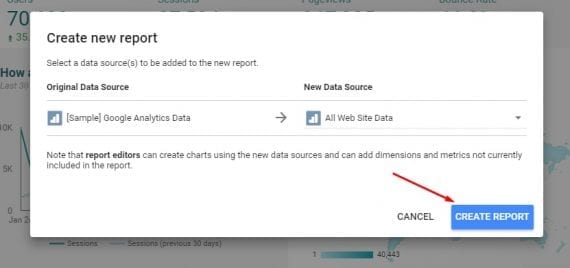
Click the “Create Report” button.
The Data Studio report will populate with your data. You are off and running. There are many tutorials and menu guides in Data Studio to help customize your own report.