Reporting on overall revenue and revenue by channel is among the most essential data for a niche ecommerce company to grow its business. Google Analytics has a powerful revenue-reporting suite called “Enhanced Ecommerce.”
I will review Enhanced Ecommerce in the post. I’ll provide tips for setting it up and, also, for how to use it to increase revenue.
Note that setting up all of the reporting for Enhanced Ecommerce could require a bit of development. Some shopping cart providers enable the tracking by default. Some do not. Check with your developer or your cart provider. See, also, instructions from Google Analytics for activating Enhanced Ecommerce reporting.
Getting Started
Enhanced Ecommerce reporting is located in the “Conversions” menu, on the left side.
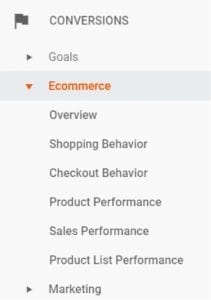
Go to the left-side “Conversions” menu in Google Analytics to access Enhanced Ecommerce.
Overview report. This Overview report is like other overview reports in Google Analytics. It is good for quickly monitoring various sales metrics.
Shopping Behavior and Checkout Behavior reports provide excellent funnels showing the path to purchase, checkout steps, and abandonment rates. I have addressed these reports and how to use them in at “Using Google Analytics to Identify Conversion Weaknesses.”
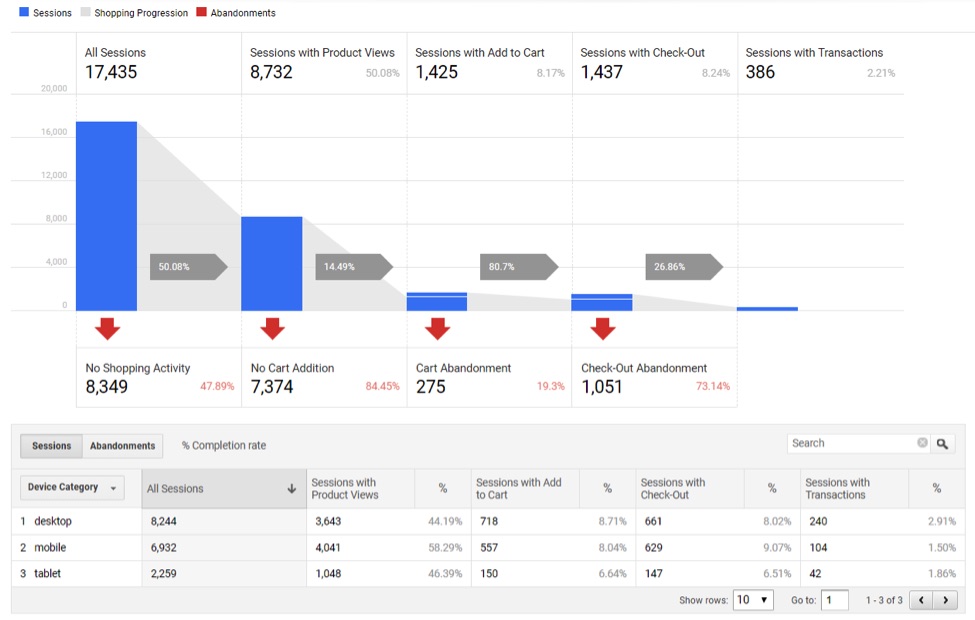
Shopping Behavior report, at Conversions > Ecommerce > Shopping Behavior.
—
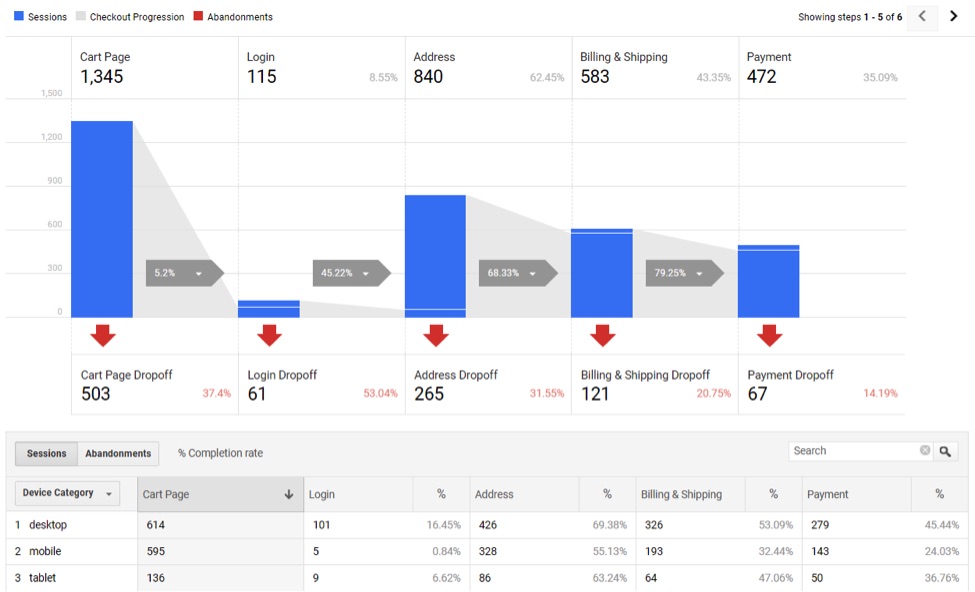
Checkout Behavior report, at Conversions > Ecommerce > Checkout Behavior.
Product Performance report provides much data on product sales, product revenue, quantities sold, and more. The two metrics that are especially actionable are Cart-to-Detail rate and Buy-to-Detail rate.
Product Performance report at Conversions > Ecommerce Product Performance provides helpful data into product sales, product revenue, quantities sold, and more. Cart-to-Detail rate and Buy-to-Detail rate (top right) are especially helpful. Click image to enlarge.
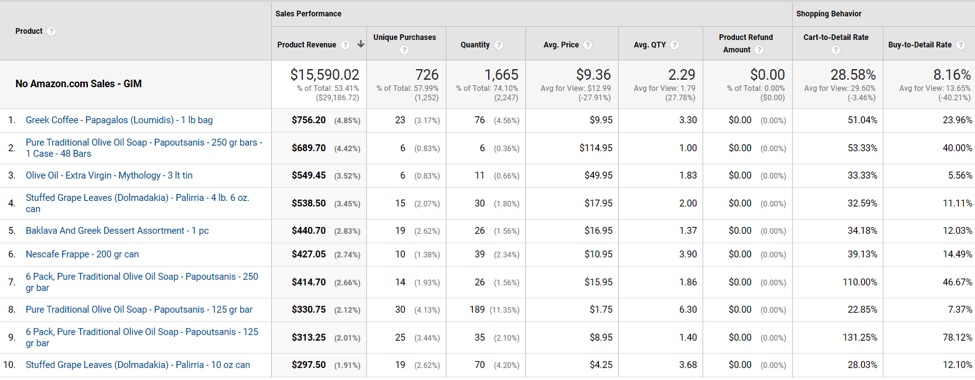
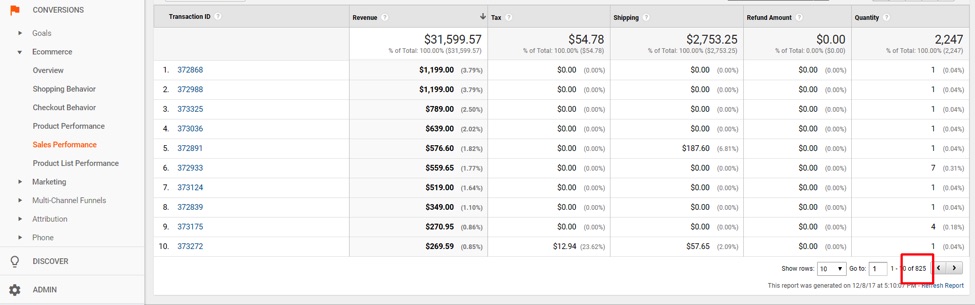
Sales Performance report lists all transactions and their corresponding revenue, tax, shipping, and product quantity. This report is useful for looking up specific sales and segmenting by channel or other dimensions, such as keyword.
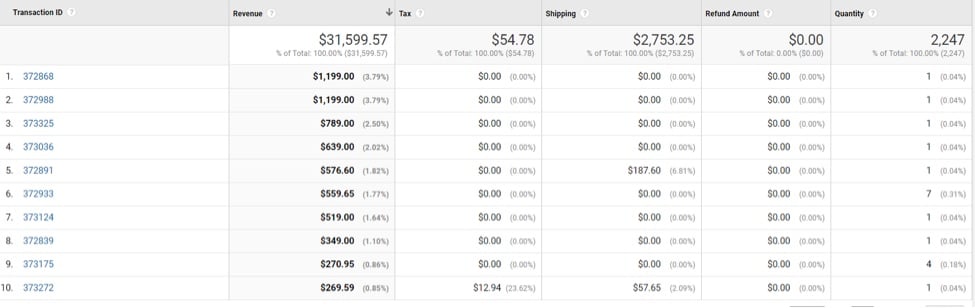
Sales Performance report— at Conversions > Ecommerce > Sales Performance — lists all transactions’ revenue, tax, shipping, and product quantity. Click image to enlarge.
Product List Performance report provides helpful data, but I am going to skip it for this article because it is challenging to set up for a niche ecommerce company. A larger merchant can more easily assemble the resources to get this reporting working — and use the volumes of data to make micro-gains in conversions.
Auditing Enhanced Ecommerce
It’s important to confirm the data in Google Analytics by comparing it with data from your shopping cart. Here are some tips for auditing the Enhanced Ecommerce reporting in Google Analytics.
- Aim for 95 percent of actual sales when confirming revenue. You won’t be 100 percent dead on, but you should be close.
- Make sure your Google Analytics or Google Tag manager tags fire high on the order confirmation page to not miss any transactions due to slow page loading or other scripts on the page slowing or prohibiting the ecommerce tags from firing.
- Make sure offline payments, such as from PayPal, are reporting. Offline payments must redirect back to the order confirmation page after payment is completed to fire Google Analytics ecommerce tags. I’ve addressed this at “Measuring Offline Sales in Google Analytics.”
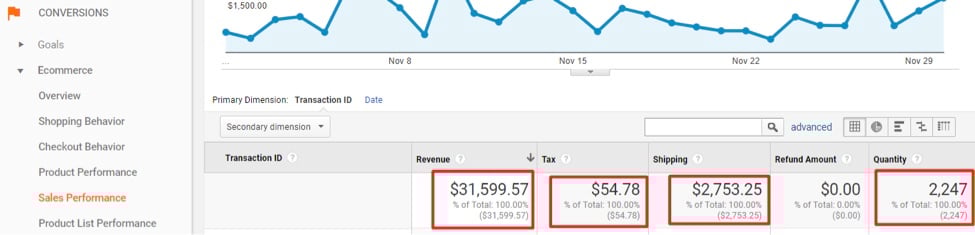
- Make sure all variables are set up correctly by comparing product revenue in the Product Performance report to total revenue (minus tax and shipping) in the Sales Performance report. Confirm the quantities in both reports, too. A material difference in one or the other reports is a starting point for identifying the root cause.
To arrive at an actual sales amount, subtract tax ($54.78) and shipping ($2,753.25) from revenue ($31,599.57) in the Sales Performance report: $31,559.57 – 54.78 – 2,753.25 = $28,751.54. Note, too, the quantity (2,247). Click image to enlarge.
—
Compare product revenue from the Product Performance report ($29,186.72) to revenue minus tax minus shipping in the Sales Performance report ($28,751.54). Also, compare the quantity on the two reports (2,247 vs. 2,247). Click image to enlarge.
Note that coupons will impact the reporting of total revenue. Thus, in comparing product revenue to total revenue (minus tax and shipping), subtract all coupon discounts.
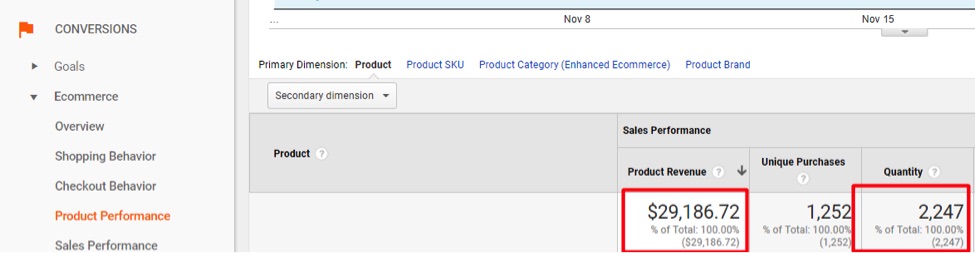
- Make sure duplicate transactions do not impact reporting by looking at total transactions overview versus a line item of transactions. These should align. If the transactions are higher in the overview report, that indicates duplicate transactions are being reported.
Total transactions in the Overview report are 845.
—
Total transactions in the Sales Performance report are 825. Click image to enlarge.
In the above example, there were 20 duplicate transactions reported to Google Analytics: 845 in the Overview report versus 825 in the Sales Performance report. That is a fairly small difference (2.4 percent) in my experience. If it’s much higher, take action. Duplicate transactions occur when someone visits the order confirmation page more than once. Blocking these transactions requires some technical expertise. A certified Google Analytics Partner can help.
Growing Revenue
To grow revenue using Enhanced Ecommerce, focus on the following metrics, in the Product Performance report.
- Cart-To-Detail rate. If this value is low (less than 10 percent), it could be a pricing issue or something else on the product page that is causing people to not add to cart. Compare products with low Cart-To-Detail rates with competitors to see if your pricing is attractive. For products that do not have competitors, look to add more information on the product page to drive more shoppers to add to cart.
- Buy-To-Detail rate. If Cart-To-Detail rate is pretty good (greater than 5 percent), but Buy-To-Detail rate is low, it could be a combination of product price plus shipping that is causing the abandonment. For products that others sell, check their total cost (product price and shipping). For products that have no competitors, look for high shipping rates compared to product price. I’ve addressed shipping-rate strategies at “Using Google Analytics to Optimize Shipping Rates.”
Use year-over-year comparisons to monitor results, comparing following metrics:
- Quantity sold.
- Quantity by channel.
- Cart-To-Detail rate and Buy-To-Detail rate by product.
Which metrics have improved? Which have decreased? Was there a change in pricing or shipping rates that could have impacted those changes?
If there are no improvements, start over! For example, I modified the price and shipping on an item earlier this year in my Greek-food-products ecommerce site. That item has much competition. We were experimenting with shifting from a low product price and low shipping to a higher product price and free shipping. We ran the modified prices for several months and saw sales drop year over year. So we switched back.