Editor’s Note: This article was originally published by Web Marketing Today. Practical Ecommerce acquired Web Marketing Today in 2012. In 2016, we merged the two sites, leaving Practical Ecommerce as the successor.
Google Analytics recently updated its layout. One of the new Standard Report sections is “Acquisition” — which contains data on how a site acquires customers, whether through ecommerce, lead generation, or fund raising efforts.
While the definition of acquisition may vary among organizations, the premise is that a site has engaged a visitor, and caused him or her to take an important action.
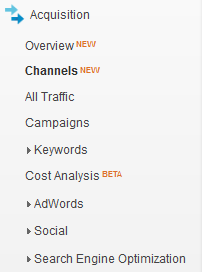
Within Acquisition there are two new views: “Overview” and “Channels.”

Google Analytics Acquisition tab,
Each of these views speaks to a specific set of numbers, and as such needs to be utilized differently.
Acquisition > Overview
“Overview” is the high-level assessment of how your website is performing when it comes to gaining customers. Two key metrics are “Bounce Rate” and “Goal Conversion Rate.”

Google Analytics Acquisition Overview section.
Bounce Rate identifies a set of web visitors, as a percentage, that come to your web site, view the first page (landing page), and then leave. In general, this means they have taken no other action on your website.
There are many things that can lead to a bounce. It’s possible that your web page is unattractive, or slow loading.
More likely, however, is that you haven’t made a connection with that visitor. For ecommerce merchants, the visitors may have seen the price of the product they were searching for, and simply didn’t like it. For lead generation, perhaps the site hasn’t thoroughly defined the product or service, and hasn’t instilled confidence in the visitor.
There’s something lacking that prevents this visitor from wanting to reach out to you.
It’s important to track the bounce rates by channels. Traffic from “Organic Search” generally has lowest bounce rates. Traffic from “Social” can have the highest, since there’s a lot of passive visitors there: Someone shares one of your products or pages, and their friends and colleagues come by to see it. That’s not the most targeted traffic; many visitors will simply view the page and move on. It’s also difficult to determine why it was shared in the first place.
Traffic from “Paid Search” is likely where you want to pay close attention. This is likely your most expensive channel; bounces through your advertising are particularly hard to stomach. Studying what causes bounces, as well as what causes conversions, in the paid channel is key to being a successful online advertiser.
Of special note to websites that do not sell products: Bounces aren’t always bad. If your phone number is prominently displayed, your visitors may well call you while looking at the first page they visit. Don’t assume a high bounce rate is crippling to a lead generation website. You need to account for those phone calls in the equation.
The third column in the Overview tab is “Conversions.” If you have created working goals in Google Analytics, this measure simply reflects your success rate in having visitors accomplish those tasks.
To be sure, not all goals are equally important. Use the drop down menu (“All Goals”) to select the goal that is most interesting to you, or to simply look at them in aggregate.
Acquisition > Channels
The second new tab in the Acquisition section is “Channels.” It contain data that is similar to Overview, but with a more detail.
The top navigation bar provides a fuller capability for segmenting by specific goal sets. So if you were interested in examining Sales, versus Leads, versus other non-revenue generating Goals, you can select that here.
Note that this view shows specific information about each of the channels, as opposed to a visual representation of how they stack up against one another. Dissect the channels that are driving your business and recreate them elsewhere. Analyze the channels that aren’t creating customers to see why.

Google Analytics Acquisition Channel section.
Clicking on any of the channel names will bring you to even more detailed information. For example, what “Social” channels are driving traffic? What bids and keywords are the most popular in your online advertising?
In any of these Channel views, utilize the blue links to gather more information. For example, in Social, some of the information is redundant if you simply click on a Network name (i.e. Facebook). However, if you change the Primary Dimension to Landing Page (versus Social Network) you’ll start to understand which social networks are driving interactions and, importantly, which shared content is generating new customers.
As with any report in Google Analytics, comparing two time periods always adds context. It’s in comparing date ranges that we start to realize trends, deficiencies, and hot web pages and products.


