Now is the time to set ecommerce performance goals for 2018. To do this, know where your business stands now. Be clear on past performance before you set goals for the new year.
Create a spreadsheet with the key metrics to track for 2018. Fill in those metrics from 2017. You may even want to insert 2016 as well. This scorecard creates good visibility and accountability for you and your team.
Your scorecard should have no more than 15 metrics, to focus on what’s important. You’ll likely track additional metrics as you improve the primary ones. But, regardless, keep your main scorecard simple so that it is usable.
Metrics for 2018
Consider using the following metrics for 2018 goal setting. They are aimed at B2B businesses, as that is my company’s focus. But they apply to all ecommerce companies, B2C and B2B
Revenue. This is the key monthly metric. You may, depending on your business, track multiple revenue categories, such as online revenue, offline revenue, after-market parts revenue, and so on. If customers fill a cart and then submit it for a quote, measure the dollars submitted via a request for quote and the close rate on your quotes.
Average order size. This is total sales divided by the number of orders in a given time period. This metric is important. You may, for example, change your marketing so that your traffic and conversion rates increase. But if your average order size goes down, your total revenue decreases, too, despite the increase in traffic and conversion rate.
Average Order Size = Sales ÷ Number of Orders
Having a lower average order size for a given time period or a given traffic source doesn’t indicate a failure. For example, Google Shopping traffic often can have a lower average order size. There are tactics to increase it. What is important is that you are aware of it and you plan accordingly.
You can easily monitor your conversion rate, average order size, and revenue. Go to the Ecommerce Overview report on Google Analytics, at Conversions > Ecommerce > Overview.
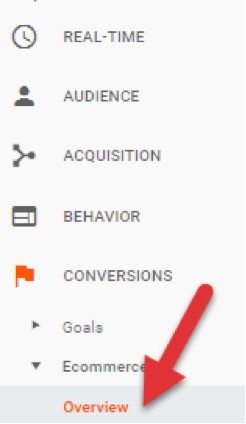
On Google Analytics, monitor conversion rate, average order size, and revenue at the Ecommerce Overview report.
—

Find the Ecommerce Overview report at Conversions > Ecommerce > Overview.
Revenue by channel. Track revenue by channel, such as paid search, organic search, email, and direct. You can also track traffic and conversion rate by channel. But, include only revenue in the main scorecard, to keep it simple.
In Google Analytics, track revenue by channel at Acquisition > All Traffic > Channels.

Track revenue by channel at Acquisition > All Traffic > Channels.
—
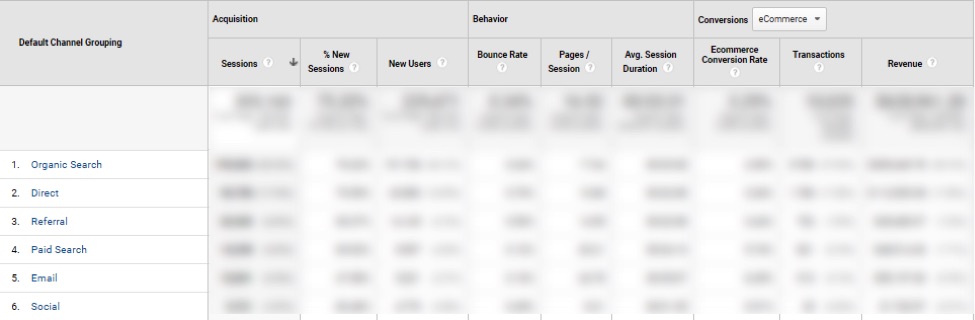
Tracking revenue by channel can identify where to focus marketing efforts.
Conversion rate by device. Buyers use multiple devices. Keep track of which devices generate the most conversions by monitoring three conversion rates:
- Desktop conversion rate.
- Mobile conversion rate.
- Tablet conversion rate.
Monitor these in Google Analytics at the Mobile Overview report, at Audience > Mobile > Overview.
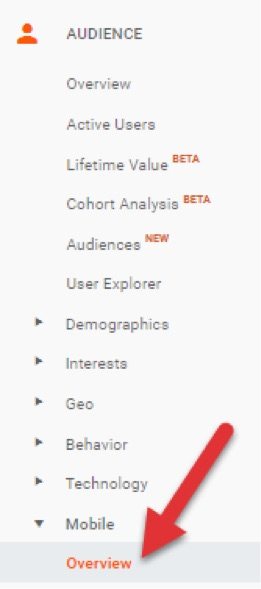
Monitor the conversion rate by device at the Mobile Overview report.
—
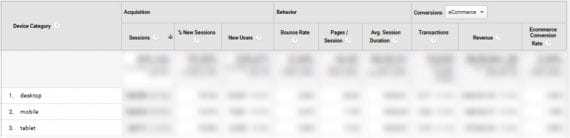
Find the Mobile Overview report at Audience > Mobile > Overview.
Ship time. What is the average amount of time from when a customer places an order to when that order ships? The quicker the turnaround, the happier the customer. Monitor your ship time and work to reduce it. I’ve seen ecommerce merchants turn this into a competitive advantage. Some even create a guarantee around it.
Take the example of FireFold, which sells home networking and electronics equipment. It offers same day shipping for all items, B2C and B2B. The company promotes this throughout its website. The promotion on its shipping policy page reads, “FireFold offers convenient, same day shipping on most in-stock items. Orders placed before 5:00 p.m. Eastern Time ship same business day.”
FireFold’ s ship time is a competitive advantage. FireFold promotes same-day shipping throughout its website.
Monitor ship times in your backend order and fulfillment system, or manually by your operations team.
Customer service. Include a metric on your scorecard that addresses customer service. There are different ways to approach this depending on your tools. One of the best ways to measure customer satisfaction is the Net Promoter Score, which accesses customer loyalty. Tools to measure the Net Promoter Score include Retently, Promoter.io, and Wootric.
Responsive service leads to satisfied customers. One way to measure responsiveness is via email and live-chat reply times.
Return on ad spend. Return on ad spend is the ratio of revenue (or profit) generated from an advertising campaign divided by the cost of the ads. Measure overall ROAS in your 2018 scorecard. As you work to improve it, you will likely track ROAS for each campaign, too.
Purchase frequency is the number of orders placed online over a given time divided by the number of unique customers for the same period. This metric provides insight into the lifetime value of customers — long-term relationships are typically critical for B2B merchants.
Percent of customers online. Online sales are often just a portion of total revenue for B2B businesses. For these companies, it is important to know the percentage of customers that buy from them online. Those customers may not purchase exclusively online. But the more customers that place orders online, the greater the likelihood of improving customer satisfaction and retention, to meet growing online competition.
Operating income is revenue minus the cost of goods sold minus operating expenses. Work with your accounting team to measure operating income from ecommerce transactions. Many B2B companies see overall operating income improvements through the efficiency and integrations of ecommerce. Clarity on this could drive future online investments.
Setting Goals
With a scorecard that can track 2018 results versus prior years, you are ready to set goals. Start with a strategic planning exercise, to review your company’s mission, vision, 3-year goals, brand, and unique selling proposition.
Analyze your company’s SWOT — Strengths, Weaknesses, Opportunities, Threats. Strengths and weaknesses are internal to your company. Opportunities and threats are external, influenced by trends in the market or by competitors.
What will your ecommerce revenue and operating margin be in 2018? Set goals and create a plan to reach them. This could require difficult changes. Solicit external opinions and perspectives on how your business compares to competitors.
Be careful not to focus on a single metric and lose sight of the overall picture. Will the methods of meeting a goal hurt you in the long run? For example, more revenue doesn’t always mean more profit. Think through what you really want to achieve.
Accountability
Segment your annual goals into quarterly milestones. Assign different people to be accountable for each one.
Track your metrics weekly. Measure your progress. Review it with your ecommerce leadership team.
For pointers on running these weekly meetings and keeping your team accountable, read Traction: Get a Grip on Your Business, by Gino Wickman. I use the system from this book — called the “Entrepreneurial Operating System” — to hold my staff and me accountable for results.