Editor’s Note: This article was originally published by Web Marketing Today. Practical Ecommerce acquired Web Marketing Today in 2012. In 2016, we merged the two sites, leaving Practical Ecommerce as the successor.
Facebook Page Insights is an essential tool for monitoring and evaluating your Facebook marketing efforts. There are many other online tools that provide deeper analytics and surveillance solutions, but Facebook Insights gives a basic rundown of how your page, its posts, and even those of your competitors, are performing.
Overview

Facebook Insights presents three key pieces of information front and center on the Overview page.
The Overview page displays a brief summary of the kind of information that you can find in greater detail in other Insights’ pages. It limits statistics to performance over the past week, but you can choose a particular date range on any of the other pages.
Overview page features include:
- Likes. The total number of page likes and how much they have increased or decreased over the past week, as well as new page likes and how they compare to the previous week;
- Reach. How many total Facebook users your page or posts reached and the increase or decrease compared to the previous week. It also compares your reach over the past week and how it compares to the previous;
- Engagement. The total number of engaged followers over the past week, along with a comparison to the week before. It also breaks down the engagement types among likes, comments, shares, and post clicks. Building engagement should be one of your primary Facebook marketing goals. The reason: When followers engage with your content, Facebook gives your post more relevance in their News Feed. They will not see your content if they never engage with it, otherwise;
- Most Recent Posts. This section lists the five most recent posts on your page and how they are performing;
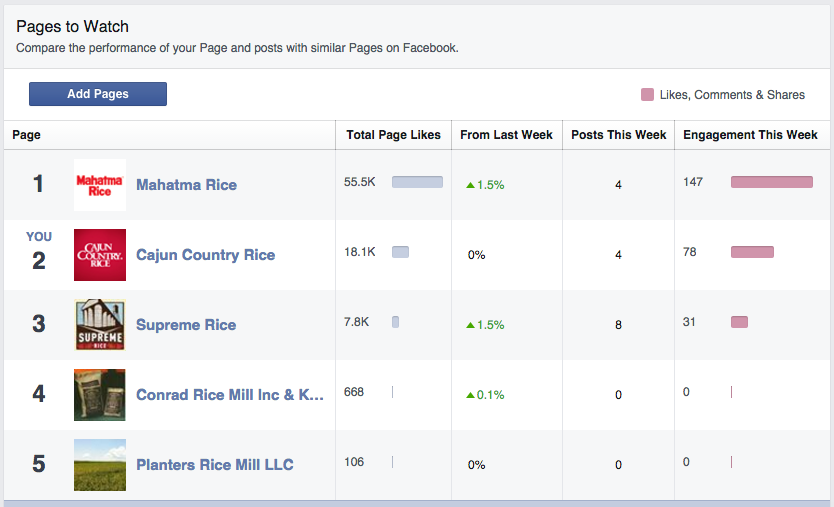
- Pages to Watch. This is the most valuable feature of the Overview page by far. You can add the Facebook pages of your competitors, ranked in order of the number of Likes (Facebook includes your page in these rankings as well.). Also, you can see how your page compares to those of your competitors regarding the number of posts and engagement for the past week. Pages to Watch also suggests other pages that you should follow.

Pages to Watch is one of the best features of Facebook Insights.
Except for Pages to Watch, each of these sections includes a button that will take you directly to that particular page within Insights, for more detailed information. This feature is only available on the Overview page.
Likes
This section of Insights lists the likes for your page, as opposed to post likes, the latter of which you can find on the Posts page. The top section of this page allows you to select a specific date range for the data you’d like to see.
You can drag the slider manually, to choose the range or use the start and end date calendars, located on the side. You’ll notice the slider section includes a preview graph of the activity listed on the page.
Total Page Likes as of Today gives you the number of current followers on your page and shows you the growth in likes over the chosen time period. Hover your cursor over the graph, to see the total number of likes for that particular date.
You may notice that these figures increase and decrease on a day-to-day basis. The decreases are on the days where your page lost more followers than it gained. You should see an overall upward trend here. If not, you will need to reevaluate your posting strategy.
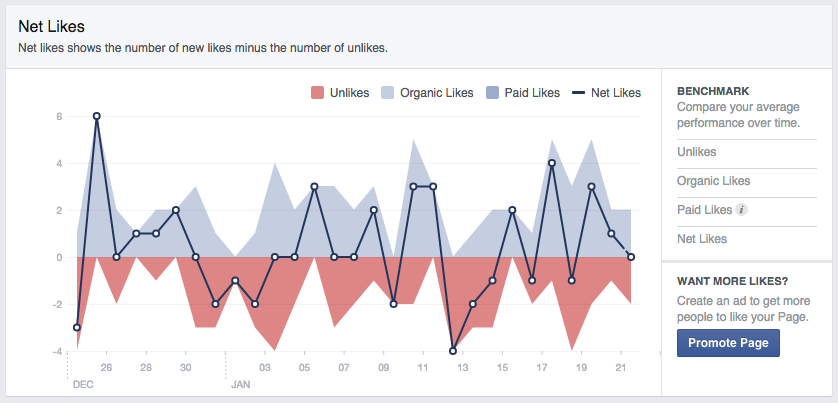
Net Likes shows the number of new likes minus the number of unlikes and includes four different points of data. First is the number of unlikes (the red portion of the graph), which shows how many unlikes your page received on a daily basis within the timeframe set.
Next is the number of organic likes, in light blue. Organic likes are unpaid, meaning your page received them naturally. Paid likes are next, which are those gained using ads. Last are your net likes, represented as a line graph that shows your daily net gain or loss.

You can expect ups and downs, but there should be more ups.
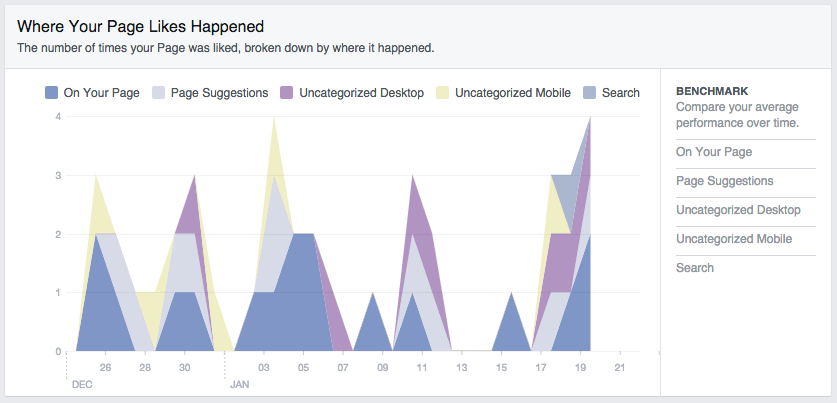
Where Your Page Likes Happened takes the number of likes you’ve gained and breaks it down by where they happened, using the following data points:
- On Your Page. Users who liked your page by visiting it directly;
- Page Suggestions. These occur when someone follows your page based on an interaction that one of their friends had with your content. (You’ve probably seen these in your News Feed.) This is one of the many reasons building engagement is so important;
- Uncategorized Desktop. Likes from a desktop device that cannot be categorized;
- Uncategorized Mobile. Same as above but on a mobile device;
- Search. Users who searched Facebook for your page specifically, and then started following you.

Where Your Page Likes Happened presents multiple data points, shown in graph form.
That information is vital because it details how your audience typically finds you on Facebook, which can influence your future marketing strategies. It also shows where you’re lacking so you can adjust as needed. For example, if you are not gaining any new likes from Page Suggestions, you may want to start using more calls to action in your post content, such as “Like this post!”
Reach
Reach is Facebook’s version of impressions. In other words, it’s simply the number of people that have seen the page or posts in some fashion.
Post Reach applies to the number of users — both followers of your page and non-followers — who have seen your posts only. The two sets of data shown here represent organic and paid post reach, also known as boosted or promoted posts. If you’ve followed my advice from previous articles regarding Facebook advertising, you know that paid reach will far outweigh organic reach.
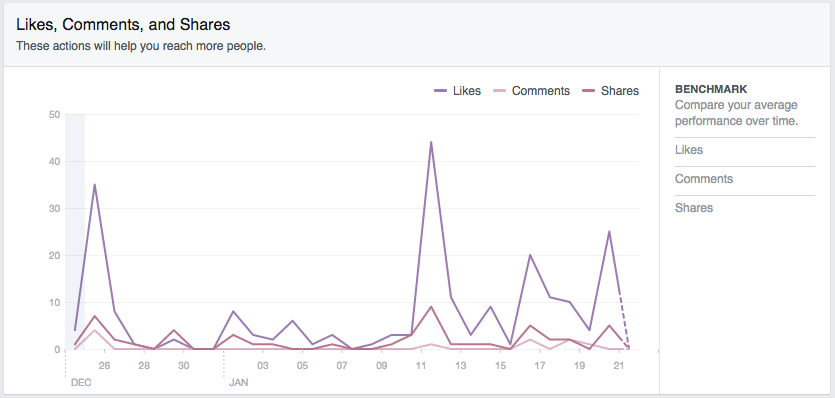
Likes, Comments, and Shares reports exactly what it states, and is directly tied to your page’s engagement. Increasing these will help you gain additional reach through the page suggestions, mentioned above.

Engagement is one of the most important performance metrics.
Hide, Report as Spam, and Unlikes reports the number of users who do not want to see your content in some form or another. Individually hidden posts and unlikes are usually not that concerning, as they’re bound to happen for any page.
It can be a much larger issue, however, when users hide all of your posts or report something as spam on a regular basis. Hiding all posts can be a routine occurrence if you use like ads, so a few here and there are no big deal. Your posts should almost never be reported as spam, however, and you should consider a serious reassessment to your posting strategy if this happens with even a degree of regularity.
Total Reach applies to any method your page or its content has reached others on Facebook, including posts to your page, check-ins, or page like ads. Insights segments data into paid and organic reach.
As you can tell, Facebook Insights presents a lot of information, so much that I will have to outline the rest in part two of this guide, which you can read in two weeks.


