Ecommerce merchants must produce profitable traffic from their advertising efforts. Cash flow is essential. Traffic acquisition must be efficient. However, not all traffic channels drive immediate sales. Some channels assist buyers in their purchase journey but are not the final, direct click that leads to a sale. Those channels can be profitable and worthwhile with an understanding of the purchase cycle.
Google Analytics’ Multi-Channel Funnels reports can evaluate all advertising channels, to determine their value even if they did not represent the final click.
In this article, I’ll explain how to use Multi-Channel Funnels reports. The three sources of traffic I will address are social media, display advertising, and Google Shopping ads.
These three sources can represent 20 percent or more of an online merchant’s traffic, and their return on investment is typically undervalued in Google Analytics’ standard reports.
To access the Multi-Channel Funnels reports, go to Conversions > Multi-Channel Funnels.
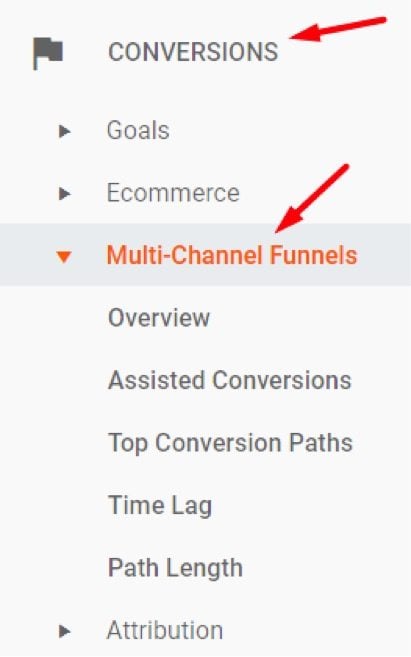
To access the Multi-Channel Funnels reports, go to Conversions > Multi-Channel Funnels.
The “Overview” report shows how different channels interact over multiple sessions. This can provide a visual story of how shoppers engage via different channels across two or more sessions prior to purchase.
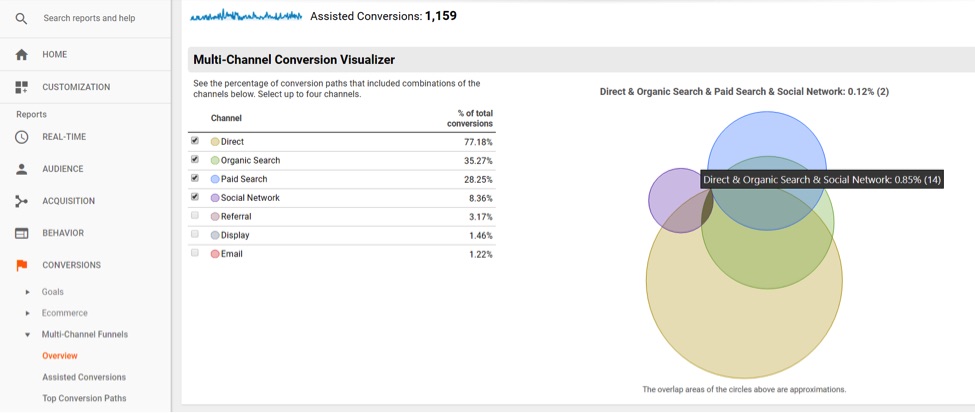
The “Overview” report can provide a visual story of how shoppers engage via different channels across two or more sessions prior to purchase.
The “Assisted Conversions” report shows both “Assisted Conversions” and “Last Click or Direct Conversions,” along with their conversion values.
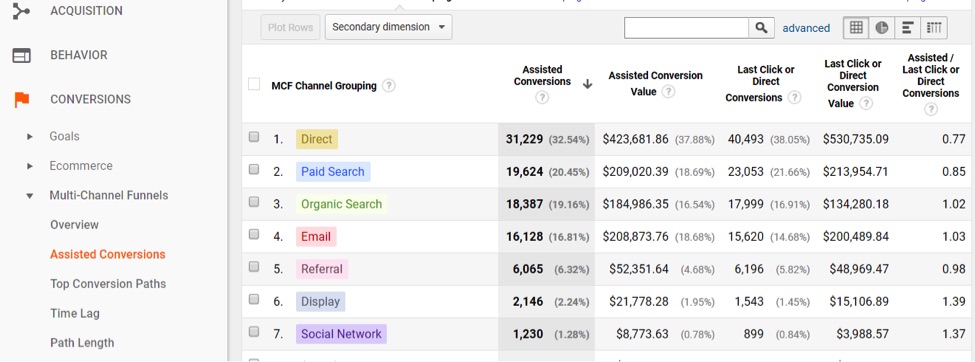
The “Assisted Conversions” report shows both “Assisted Conversions” and “Last Click or Direct Conversions.”
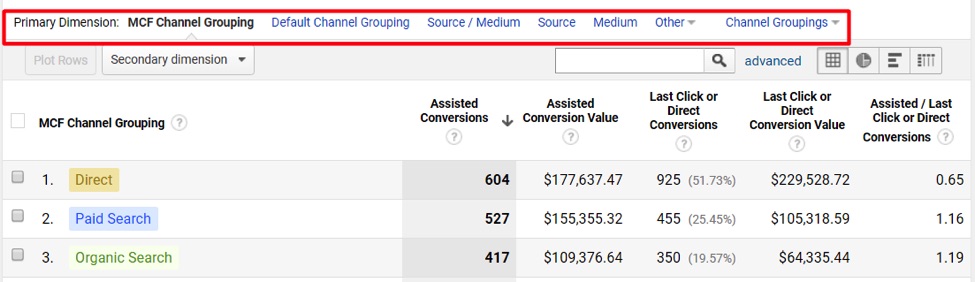
A metric called “Assisted / Last Click or Direct Conversions” on the far right of the report provides an overview of the conversion data to the left of this final column. Channels above 1 are better at assisting sales than closing sales. Values below 1 are better at closing sales than assisting with sales.
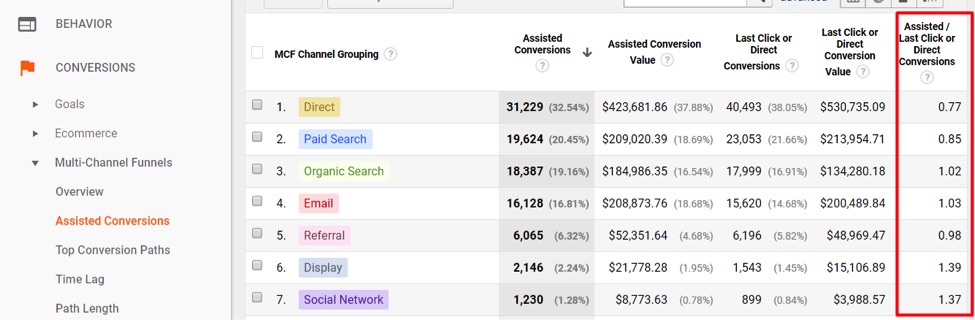
“Assisted / Last Click or Direct Conversions” on the far-right of the report provides an overview of the conversion data to the left.
Notice that “Display” and “Social Network” have the highest ratios in the above graph. This is typical behavior for display ads and social media, in my experience.
If your Google Shopping campaigns have “Shopping” in the name or some other pattern, select a Secondary Dimension of “Campaign” and then include the filter pattern for your Shopping campaigns. The example below shows a very high assist ratio of 2.46, which can be typical for Shopping Ads.
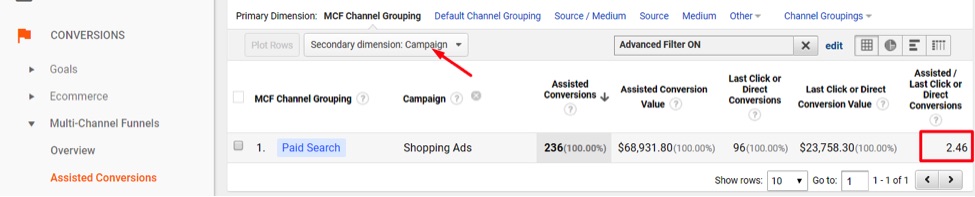
If your Google Shopping campaigns have “Shopping” in the name or some other pattern, select a Secondary Dimension of “Campaign” and then include the filter pattern for your Shopping campaigns.
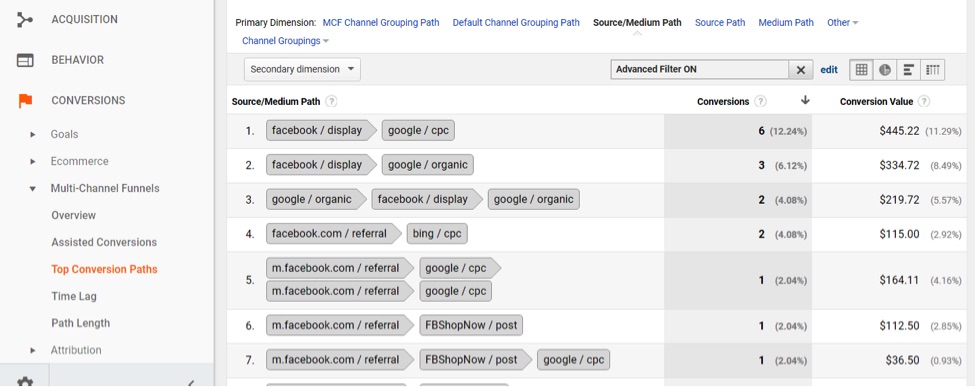
There are other ways to view the data, such as by “Source / Medium,” or just by “Source” or “Medium.” I usually start with “MCF Channel Grouping,” then focus on “Source / Medium,” where I start drilling down into reporting.
One option to view the data is to start with “MCF Channel Grouping,” then focus on “Source / Medium.”
With ecommerce sites, I typically change some settings in the reporting, which stay with me during my entire reporting session in Multi-Channel Funnels. At the very top of the reports, I will select “Ecommerce” as the “Conversion” type and deselect all “Goals” so the reporting focuses on ecommerce transactions and revenue. I keep “All” for conversion “Type” and keep the “Lookback Window” at 30 days prior to conversion.
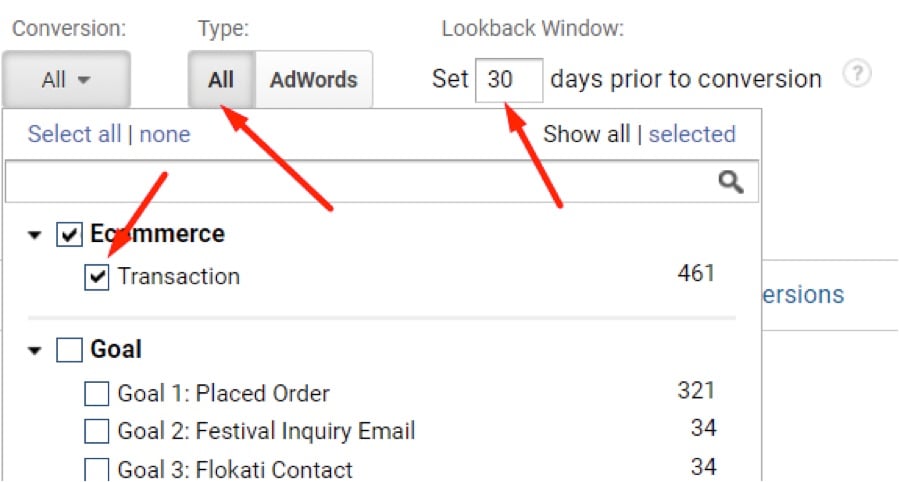
Select “Ecommerce” as the “Conversion” type and deselect all “Goals” so the reporting focuses on ecommerce transactions and revenue. Keep “All” for conversion “Type” and keep the “Lookback Window” at 30 days prior to conversion.
Facebook Traffic Reporting
To zero in on Facebook traffic, create a conversion segment by going to the top of the reporting and click on “Conversion Segments.” Then configure the segment to report only “Assisting Interaction” from “Source / Medium” containing “facebook.”
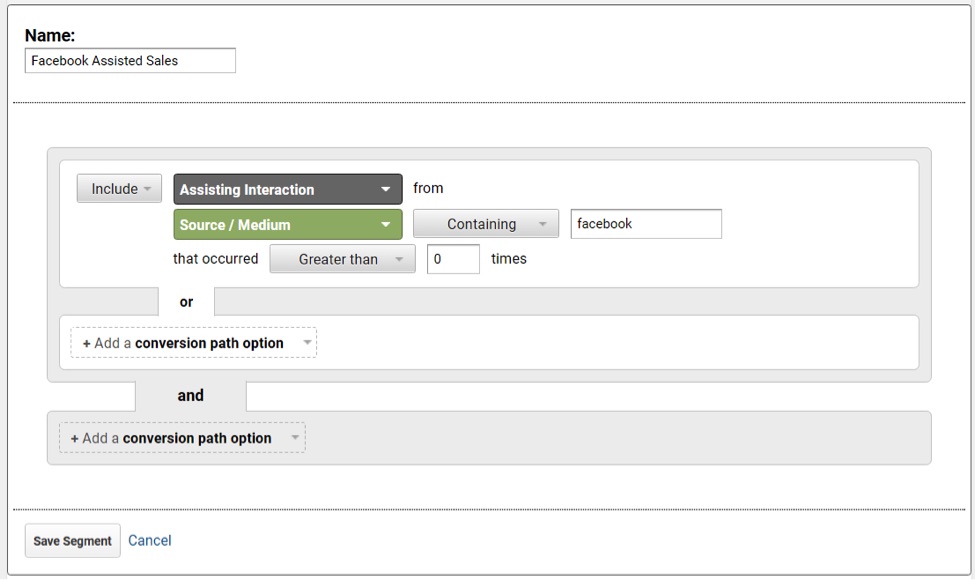
Configure the segment to report only “Assisting Interaction” from “Source / Medium” containing “facebook.”
—
To exclude conversions where the last click is direct or Facebook, add exclusions for those two sources.

To exclude conversions where the last click is direct or Facebook, add exclusions for those two sources.
—
You can then see how Facebook traffic assisted with sales but did not close them.
In this report, Facebook traffic assisted with sales but did not close them.
In the standard Google Analytics reports, none of the above revenue would be attributed to Facebook, rather to cost-per-click or organic or some other channel that closed the sale.
Putting It All Together
Google Analytics shows only last-click revenue in the main reports. But Multi-Channel Funnels reports provide additional value generated by channels that assist sales. If a channel is in question, use the Multi-Channel Funnels reports to identify the additional revenue not included. Or, use Multi-Channel Funnels to report all revenue where a channel either assisted or closed sales. Compare that total revenue to total advertising spend to see if return on investment is acceptable for a given channel.
If ROI still looks bad after accounting for assisted revenue, reduce the per-click cost, the overall spend, or just scrap the channel altogether. If ROI is acceptable after accounting for assisted revenue, keep the channel and try to grow profitable traffic from it.
Using Multi-Channel Funnels requires a little more effort than standard Google Analytics reports. But it can also provide more ROI clarity of a channel — whether good, bad, or somewhere in between.