Performance metrics can help ecommerce businesses measure progress and assess financial and marketing health.
But with so much data available from tools like Google Analytics, it can be hard to know what to measure or even what those measurements mean. With this in mind, I put together a list of the metrics I pay attention to most. For the sake of brevity and readability, I will split this list into three parts. In this first part, below, I will focus on the financial and operational metrics that I monitor, along with the first half of the web traffic stats I follow. Every business is a little different and may need to focus on one aspect or another of the operation from time to time. Nonetheless, I believe that this list is a good place to start.
No. 1: Profit
Measure your net profit hourly, daily, weekly, monthly, annually, and all time. This doesn’t mean that you need to check it on this schedule, but rather track it in these time segments.
If you have a good ecommerce platform, it will do the hard part for you, recording and organizing sales data, shipping costs, and the cost of goods sold. Use this data along with your fixed and variable overhead to determine how much money your business is making and when. The granularity will help identify trends, cut costs, or calculate return on investment from your marketing and advertising efforts.
To start, try to determine which hours of the day your business is most profitable and for a week focus all of your pay-per-click (PPC) advertising and social marketing on those hours alone. See what the change does for your bottom line.
Finally, be sure to pay attention to cash flow too, since, that’s what pays the bills.
No. 2: Revenue
Just like profits, keep track of revenue on an hourly-through-all-time basis. Knowing the difference between how much is coming in and how much is dropping to the bottom line is an excellent way to identify costs that can be cut or to find those campaigns or projects that are producing the best returns.
For example, monitor revenue right after sending out a newsletter or posting a new video on YouTube.
No. 3: Average Sale
In many ways, the Holy Grail of ecommerce is selling more to each individual customer, since cost of acquisition (think PPC advertising, emailing marketing monthly fees, and display advertising) can be a major expense.
Of course, it will be hard to figure out how to get each customer to spend more if you don’t know what those customers are spending now. A good ecommerce platform should track this statistic for you. So your job is to check it at least daily, monitor trends, and look or spikes or dips after specific marketing events.
No. 4: Order Processing Time
When you order a Big Mac at McDonalds, the restaurant tracks and monitors how long it takes for you to get your food. This is important since there is a direct correlation speed of delivery and customer satisfaction. Just ask Zappos—that company put its warehouse in Kentucky near the FedEx air hub so that it could ship later into the evening and get orders to customers sooner.
Short of relocating your shipping center, you can monitor the time between when an order came in and when it was shipped. The goal should be to keep this under 24 hours. But faster is always better.
If you are really striving for excellence, also track when the package arrives. Over time compare delivery times for different carriers and service levels. You may find that there are ways to get products to your customers more quickly without spending more.
No. 5: Site Visits and Conversion Rate
Counting the number of sessions (when your web store is called from the web server) that visitors initiate is an important baseline measurement. It is analogous to counting the total number of people that pass through the front door of a brick-and-mortar store.
Detail of Google Analytics showing the number of visits.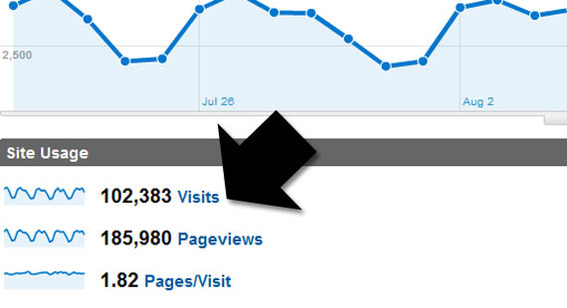
I recommend using this statistic in conjunction with order counting to learn your site’s purchase conversion rate. If you have 100 visits and 10 sales, your site’s purchase conversion rate is 10 percent.
This information can be essential to making good marketing or on-site merchandising decisions. Specifically, imagine that you think it is a good idea to add related products to a new section of your website. Monitoring visits and conversions over time should demonstrate whether or not your related products section worked.
No. 6: Absolute Unique Visitors
If site visits are like counting all of the people that enter a store, absolute unique visitors can be thought of as only counting those people once. So if a customer named Fred visits ten times, we still only count Fred as one.
Detail of Google Analytics showing an overview of absolute unique visitors.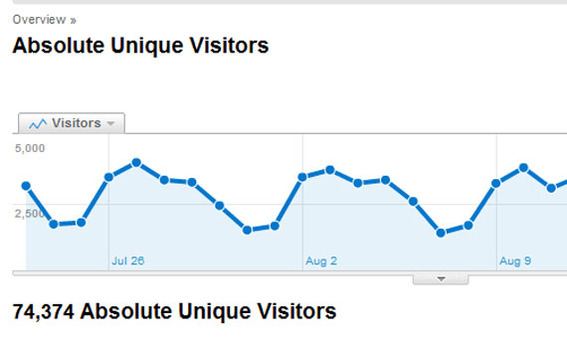
Some (if not most) customers are likely to come back more than once before making a purchase decision. By comparing your absolute unique visitors to your total visits and total orders, you can learn how many visits on average its takes before a shopper becomes a customer.
If the total number of visits required to convert is high, say 5 or more, you should focus your on-site marketing on converting at a higher percentage.
If the ratio of visits to absolute unique visitors is low, perhaps 2-to-1 or worse 1-to-1, you need to work on building brand, loyalty, and repeat business.
No. 7: Time on Site
Nearly all web analytics packages will calculate how much time a user spends on your site. For the purposes of ecommerce, we can use these as a measure of customer engagement and site usability.
Detail of Google Analytics showing average time visitors spent onsite.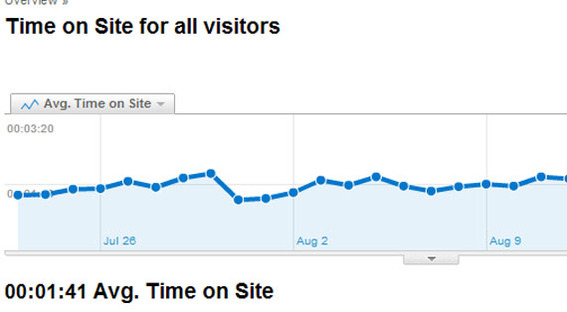
Online stores with blogs, good video content, product reviews, and configuration tools or advanced search should expect to see average time on site grow as these features are added.
Very low average time on site figures can often indicate that shoppers did not trust your site, did not see a relationship between what brought them to your site and what they found (i.e., a PPC ad), or did not like your site aesthetics.
No. 8: Average Page Views
A second measure of customer engagement can be average page views. This statistic tracks how many site pages the typical visitor sees.
Detail of Google Analytics showing the average number of page views per visit.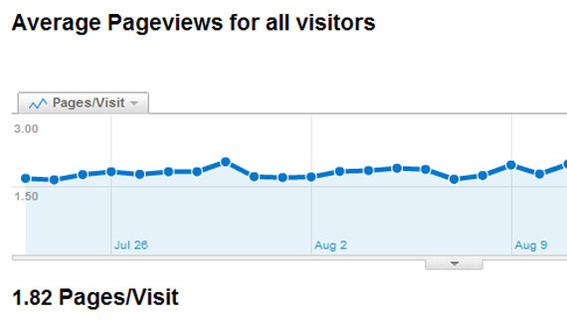
Summing Up
In the second part of this series, I will describe more of the web traffic metrics I monitor, including direct traffic, which is one of my favorite marketing and brand indicators.