When it comes to ecommerce analytics, business owners and marketing managers typically focus on metrics like conversion rates, number of transactions, and average order value.
These are valuable, and should be monitored. After all, measuring such outcomes is what directly impacts revenue and the bottom line.
Thanks to Google Analytics as well as Mixpanel, Flurry, Site Catalyst, and other analytics platforms, these ecommerce metrics are readily available to site owners.
Conversion rates, number of transactions, and average order value are easy to measure.
While focusing on the outcomes is key, close attention to tracking user behavior and interaction with the site or mobile app will also yield significant incremental improvements. Here are five interactions you don’t see a lot of people measuring, when they really should be.
1. Product Categories
You can easily report on top products, what’s selling, and what’s not selling on your website. However, go beyond that and consider rolling up your reports to the product category level. As can be seen in the screenshot below, some categories can be driving more revenue than others. In this example, it seems that men — or those who buy gifts for men — spend more money on watches.
Setting product categories can help you determine which products are selling best.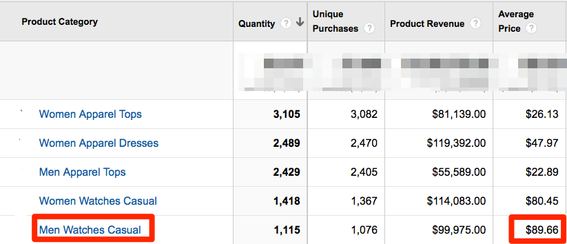
Once you have your categories identified, segment one layer deeper to get insights on product categories by traffic channel, campaign, or even by keyword. See what’s driving high-ticket items and categories, and where the marketing dollars should continue to flow
2. Product Comparison
Many ecommerce sites allow shoppers to list products next to each other for ease of comparison — dimensions, features, pricing, and other features — and also for an opportunity to upsell the higher value products.
Create a metric to track product comparison data.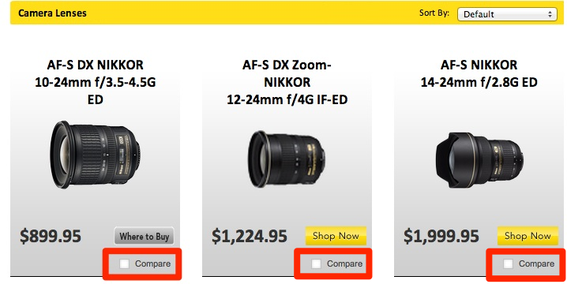
If your site has thousand of products, or even hundreds, it’s not practical to list them all in a comparison table. What you typically see is a selector box for shoppers to check on the products they want to see next to each other.
One useful measurement technique in this scenario is to track the specific user interaction — with an “event” if you are using Google Analytics or Mixpanel. From there, you’re able to track the products that are getting compared. You can then run reports on what products are purchased and each product’s presence — or lack of presence — in the comparison interactions, and assess any correlation between the two.
In addition, you may find there are products you prefer to be considered yet aren’t getting selected by users for comparison. Now that you have this information, you can take action. For example, you might promote your preferred products on banners, on your home page, or in your email marketing campaigns.
3. Live Chat Tracking
You have probably seen live chat features on sites more often than not. You come to a site to check out a service or a product and you’ll see an invitation — sometimes a pop-up — asking if you would like to chat with a customer support agent. I’ve seen ecommerce businesses where the average order value is 25 to 30 percent higher when a purchase included a live chat.
This is not a general recommendation for each site owner to run live chat. Test it in your environment to assess what works for you.
If live chat is a service you offer, or are considering, it’s important that you track how many of your visitors are using live chat and of those visitors, determine:
- Conversion rate;
- Average order value;
- Overall generated revenue.
If you implement live chat correctly, you can further measure the impact on product purchases in specific categories. For example, if there’s a high correlation between high-ticket purchases and live chat interactions, it might be profitable to hire additional staff for extended live chat hours.
4. Shopping Cart Removes
While it’s common to measure “Add to Cart” clicks to track which products are added to the online shopping cart and track based on where that action occurred — whether they are on the product page, promo page, or a product modal — it’s also useful to also track cart removes, or the products that visitors added to cart and then later removed.
Let’s say you sell trampolines and want to sell add-on items such as safety nets. If you start seeing a lot of cart removes of safety nets, maybe it’s time to consider offering a discount on the combination of the trampoline and the safety net or send follow-up emails with a promotion to shoppers who didn’t complete the purchase of the safety net.
5. Know Your User Segments
If you follow my articles, you know I emphasize segmentation. In actuality, I don’t think I emphasize it enough. Real gems are found in zooming in on a segment of users along with the purpose of their visits. If you are new to the concept of segmentation, write down the various types of customers that buy from you.
For example, you might be primarily a consumer product store, but also have a reseller or a distribution channel. These resellers are identified upon login and your system will present the pricing and discounts that are unique to them. When tracking transactions and revenue, it’s important to segment your reports by these user types. Otherwise a large order at a highly discounted price for one of your resellers will skew your revenue and conversion data.
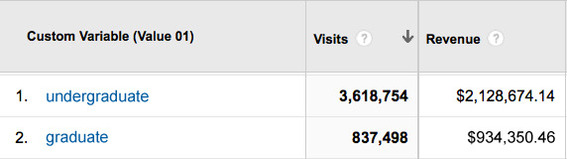
Below is a screenshot of data from an ecommerce site in the education industry. The site segments the visitors by graduate and undergraduate, and reports on the sales numbers accordingly. You can see that while the graduate visits are roughly 19 percent of the total, the revenue from those visits is roughly 30 percent of the total. If the reporting was just on aggregate visits and aggregate revenue, the site would have no idea about how each of these segments are performing and its contribution to the bottom line.
Groups with fewer visits sometimes generate more revenue.