This post will cover the 14 most important Google Analytics releases in 2014 for ecommerce and retail mobile apps. Merchants should consider using these in 2015.
1. Enhanced Segmentation of Remarketing Lists
On January 30, 2014, Google Analytics refreshed “Remarketing Segmentation” by adding new ways of slicing and dicing audience demographic data and also enabled the creation of remarketing lists based on the new audience segmentation options. The new user interface is now available and allows for the creation of remarketing lists on the basis of origin, behavior, and demographics. Go to: Admin > Property > Remarketing > Audiences.
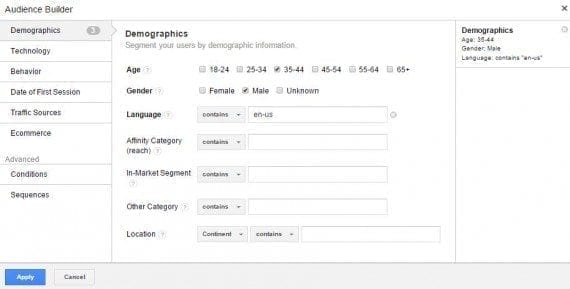
Google Analytics refreshed “Remarketing Segmentation” by adding new ways of slicing audience demographic data.
Make sure you enable “Display Advertiser Features” and “Demographics and Interest Reports” to take full advantage of remarketing lists capabilities. (It needs to be done at property level.)
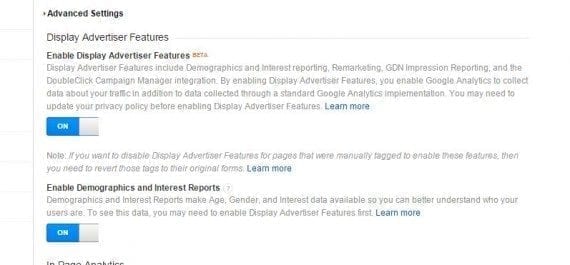
Enable “Display Advertiser Features” and “Demographics and Interest Reports” to take full advantage of remarketing lists capabilities
Remarketing lists can now be shared with:
- AdWords (Google Analytics and AdWords accounts need to linked);
- DoubleClick Campaign Manager (for Google Analytics Premium users);
- DoubleClick Bid Manager (for Google Analytics Premium users).
2. Dynamic Remarketing Integrated with Google Merchant Center
By giving the ability, on March 12, 2014, to develop retargeting lists for AdWords in Google Analytics, ecommerce managers now have a huge opportunity to improve audience targeting by using the wealth of dimensions and metrics available in Analytics. In other words, Google launched deeper remarketing integration between AdWords and Analytics.
Integration for these campaigns means that audience targeting can be much more fine-tuned to on-site behavior with access to product level reporting within Analytics. Go to: Admin > Property > Remarketing > Dynamic Attributes.
By giving the ability to develop retargeting lists for AdWords in Google Analytics, ecommerce managers can improve audience targeting by using the wealth of dimensions and metrics available in Analytics.
Here are the quick steps to the new set up:
- Create one or more remarketing lists using Google Analytics;
- Update your tags to track Product ID, Cart Value, and Page Type as custom dimensions (or metrics).
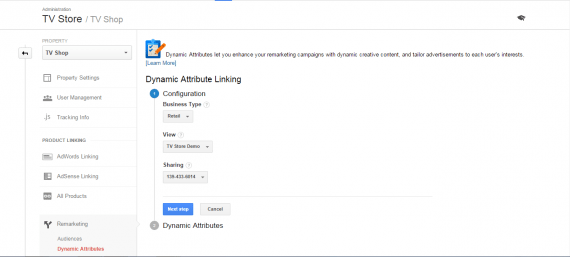
Create Dynamic Attribute Linking based on the above variables.
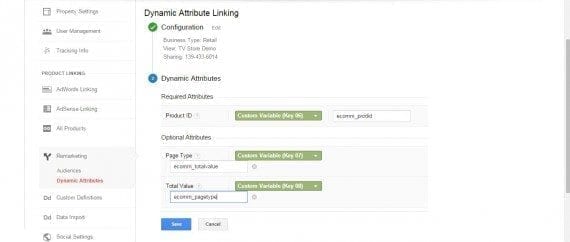
Setting up Dynamic Attribute linking.
To Enable the Dynamic Link, go to Admin > Property > Dynamic Attributes. This will let Google Analytics send attributes to your AdWords account.
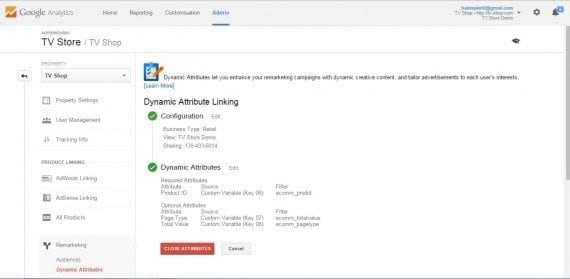
Enable the Dynamic Link in Admin > Property > Dynamic Attributes.
Dynamic Remarketing campaigns in AdWords are powered by product feeds in Google Merchant Center. Here is how it works.
- Merchant Center provides image ads based on users’ browsing history on product, category pages, and search terms in your store or website.
- Ads are then served on the Google Display Network — e.g., a user comes to your store, views a product (or multiple products), and does not convert.
- These product ID(s) are sent to Google Analytics. Then the combination of “cookie viewed product(s)” are added to the Dynamic Remarketing lists and shared with AdWords.
It’s as simple as that. You are now able to retarget users (that have not converted) by showing them the products that they viewed but not purchased.
3. Google Analytics Integration with AdMob
On March 18, 2014, Google added deep Analytics integration with its mobile ad platform, AdMob.
Users no longer have to access Google Analytics and AdMob in separate logins and interfaces. Users can now access Analytics directly in their AdMob account.
To see this feature in action, sign in to your AdMob account and look for the “Analyze” tab at the top of the page.
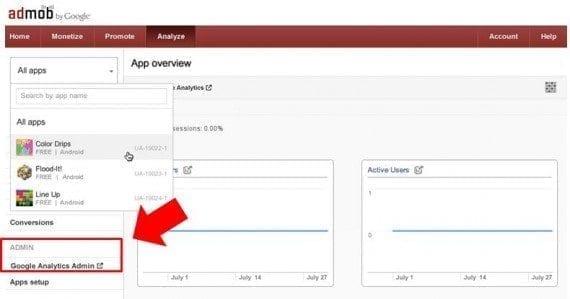
Sign in to your AdMob account and look for the “Analyze” tab at the top of the page.
The home screen features a combination of reporting from both platforms and provides a snapshot of conversion and monetization performance, including in-app purchase metrics.
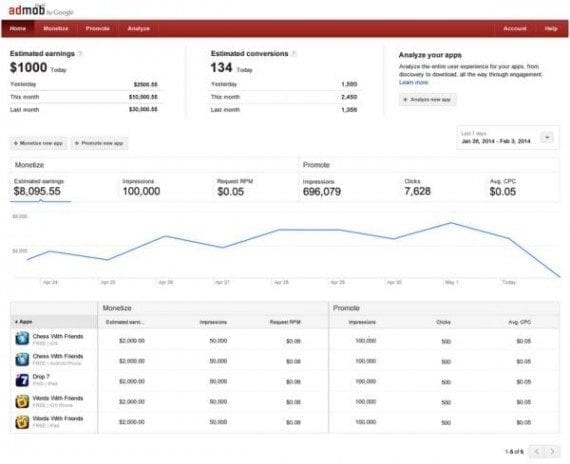
The home screen provides a snapshot of conversion and monetization performance, including in-app purchase metrics.
4. Content Experiments with Google Tag Manager, for Apps
Google Tag Manager integration with Content Experiments was a major release on March 18, 2014. It provides an easy way to set up and run experiments to change anything from in-app promotions to menu layout. With Google Tag Manager, you are able to modify app configuration for existing users without having to ship a new version. Results will then be available through the Google Analytics reporting interface.
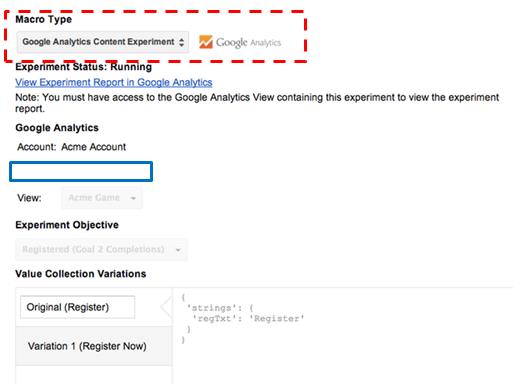
Google Tag Manager integration with Content Experiments provides an easy way to set up and run experiments.
Google Tag Manager has been built to be very intuitive, even for people not familiar with coding. Businesses can now let their marketers or business analysts run experiments without requiring a developer to be involved. App experiments are now accessible to everyone.
5. YouTube TrueView Ads Reporting
On March 25, 2014, Google launched a new Google Analytics Video Campaigns report that focuses on YouTube TrueView ads. With this new report, users can now see the detailed effects of their TrueView campaigns on their website traffic and revenue. Access the new report at Acquisition > AdWords > Video Campaigns.
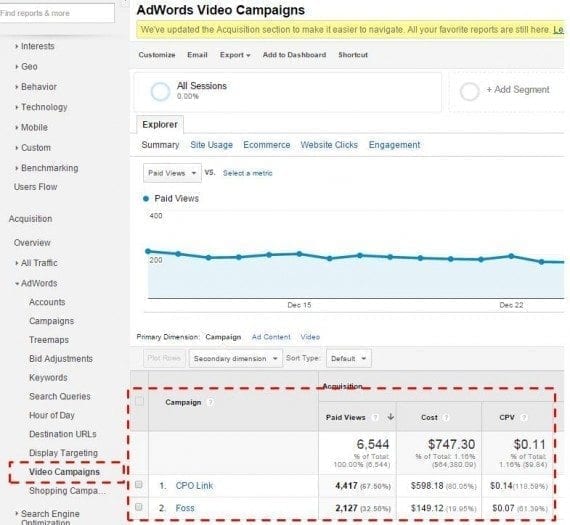
The new Google Analytics Video Campaigns report allows users to see the detailed effects on their website traffic and revenue from their TrueView campaigns.
To measure the indirect traffic generated from brand-oriented display and video campaigns, Google is still piloting the Google Display Network Impression Reporting.
This report is designed to show conversions or actions that have resulted from unclicked impressions or video views. The report displays within the Multi-Channel Funnels section under the Conversions menu in Analytics when enabled.
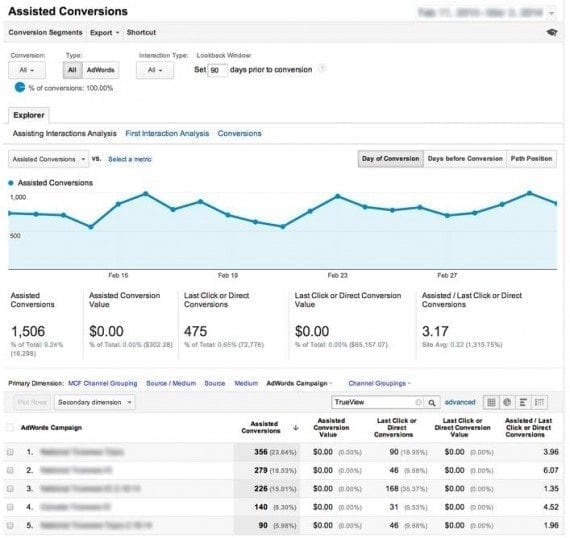
Google’s Display Network Impression Reporting is designed to show conversions or actions that have resulted from unclicked impressions or video views.
To begin working with Video Campaigns reporting, you should link your AdWords and Google Analytics accounts and start an auto-tagged TrueView campaign via AdWords for video.
6. Universal Analytics Comes Out of Beta
Google finally launched, on April 2, 2014, a fully functional version of Universal Analytics for everyone that included Classic Analytics’ full feature set and a lot more multi-device oriented features.
Here are some features that weren’t available in Classic Analytics but are now in the full version of Universal Analytics.
- Remarketing with Google Analytics.
- Audience reporting. Audience reports includes demographic data such as gender and interest categories.
- Premium service level agreement support. Google Analytics Premium users had their standard SLAs applied to Universal Analytics — such as data collection and data processing.
- Full Google Tag Manager support. Full support for Google Tag Manager that includes audience data and the new User ID feature were all integrated.
- User ID feature was rolled out to help better understand full user or customer journeys. It is able to track anonymous engagement activity across different screens or devices from visits to your site to give you a more accurate view of your traffic with the Cross Device report.
In addition to the above features, Google Analytics users are now able specify a time zone for their processed data. In the past, all data was processed in Pacific Time (the time zone for Google headquarters).

Analytics users can now specify a time zone for their processed data.
7. Analytics and AdWords Bulk Account Linking
On April 7, 2014, Google launched a new linking process that allows bulk linking of AdWords accounts at a single go within Google Analytics. You simply need to check a box next to the accounts you want to linked and click a button under: Admin > Property > AdWords Linking > New Link Group.
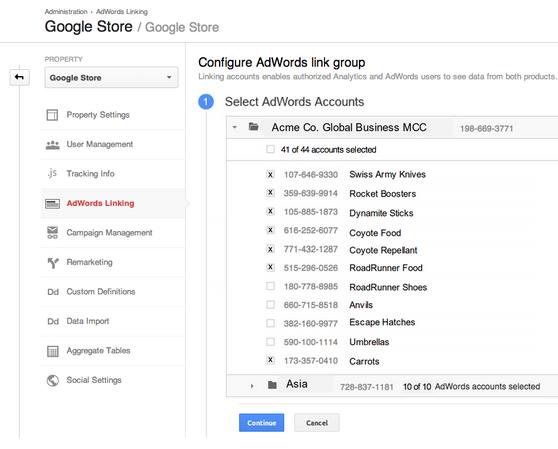
The new linking process allows bulk linking of AdWords accounts at a single go within Google Analytics.
The new “bulk linking” process greatly improves the account linking process between AdWords and Analytics. Previously, accounts used to be linked at the account level. But with this update, they are now linked at the property level.
It is good news for account owners because they don’t need to give up their password to link accounts. Anyone with edit permission at the property level can create and update links between AdWords and Analytics accounts.
8. Remarketing Smart Lists in Google Analytics
“Smart Lists,” which launched on April 9, 2014, automates and refines the decision making process of remarketing. Smart Lists relies on anonymous conversion data gleaned in from millions of websites using Google Analytics accounts opted-in to share their traffic data with Google.
At the point of creating a new remarketing list, there is now a Smart List option that enables to have Analytics manage your list for you.
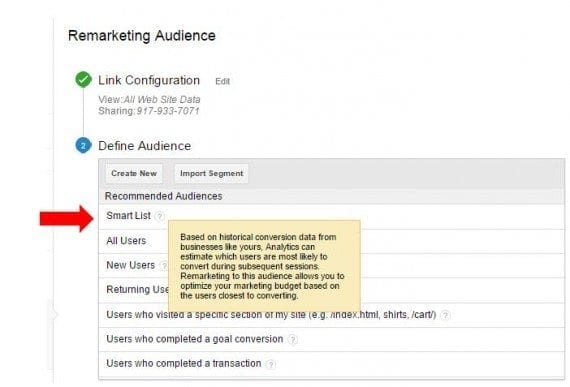
“Smart Lists” automates and refines the decision making process of remarketing.
The lists are built with machine learning using signals such as visit duration, page depth, location, device, referrer, and browser to predict which visitors are most likely to convert upon returning to your site.
Then, based on those visitors’ on-site actions, Analytics is able calibrate remarketing campaigns in AdWords to assign a value to each visitor. Access at Admin > Property > Remarketing > Audiences.
9. Google Analytics Diagnostics Notifications
The main aim of the Diagnostics notification tool — launched on April 14, 2014 — is to find data-quality issues, make you aware of them, and help you fix them.
Analytics Diagnostics scans for problems frequently. It inspects site-wide tagging, account configuration, and reporting data for potential data-quality issues, looking for things like:
- Missing or malformed Analytics tags;
- Filters that conflict;
- Self referrals or duplication in reports.
The following image shows how Diagnostics notifications will look in your account (look for it in the right upper corner of Google Analytics’ interface).
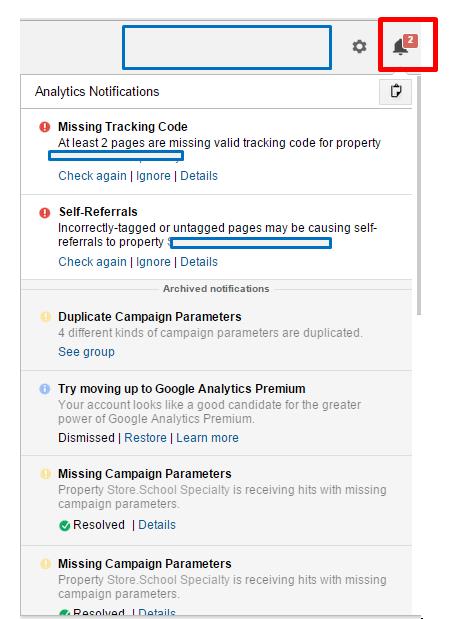
The main aim of the Diagnostics notification tool is to find data-quality issues, make you aware of them, and help you fix them.
10. Single View of Multi-device Reporting
On April 17, 2014, Google launched Cross Device reporting along with Universal Analytics. It is geared to help you view how users interact with your online store across multiple devices with the help of a User ID tracking feature.
The following image shows you a multi-device report.

Google launched Cross Device reporting with Universal Analytics to help you view how users interact with your online store across multiple devices.
The main benefit for marketers is be able look through both web and app data in a single report view. And with customized JavaScript you can more accurately collect data in your web apps.
Look at the device paths to view (a) device types — i.e., desktop, mobile, tablet — that tend to assist or start a conversions path, and (b) devices that tend to close conversions. Go to: Reporting > Audience > Cross Device.
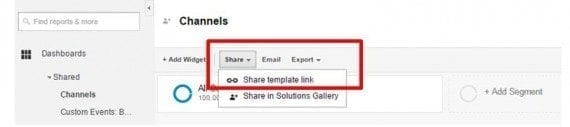
11. Permalink: Shared Assets
Permalink shared assets is a simple (yet privacy friendly) way to share Google Analytics configurations across your organization, and beyond. It was launched on April 23, 2014. Access at: Reporting > Dashboards.
With this feature you can easily share:
- Segments;
- Goals;
- Custom channel groupings;
- Custom attribution models;
- Dashboards;
- Custom reports.
Permalink shared assets is a simple way to share Google Analytics configurations across your organization.
12. Content Grouping in the Behavior Flow Report
Google quietly launched, on May 12, 2014, Content Grouping in the Behavior Flow report. This feature helps provide insight into the behavior of content categories.
To see how traffic flows through pre-defined categories, just add Content Groups in the Behavior Flow Report, at Reporting > Behavior > Behavior Flow.
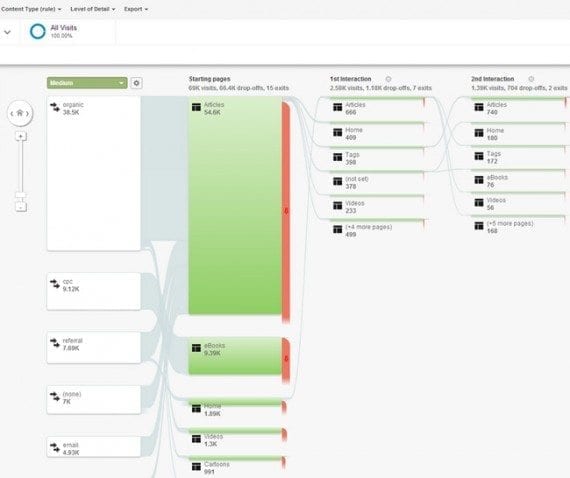
Content Grouping in the Behavior Flow report helps provide insight into the behavior of content categories.
Content Grouping allows you to organize your pages and content in different groups and categories.
The more time you spend setting up your Content Groupings, the more information you will be able to discover from viewing them in the Behavior Flow report.
Ecommerce managers can create up to five Content Groups overall and an unlimited number of Content Groups within each of these. According to Google, content can be assigned in three ways, as follows.
Group by tracking code. Adding a single line of code that identifies the content index number and the Content Group to which that content belongs.
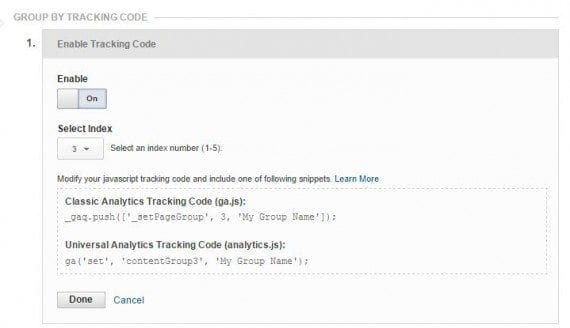
Group by tracking code.
Group using extraction. Using regular expressions to identify a full or partial URL, page title, or screen name.
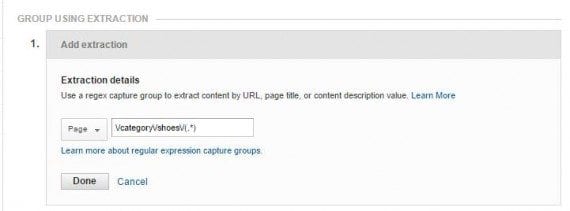
Group using extraction.
Group using rule definitions. Creating simple rules to identify content.
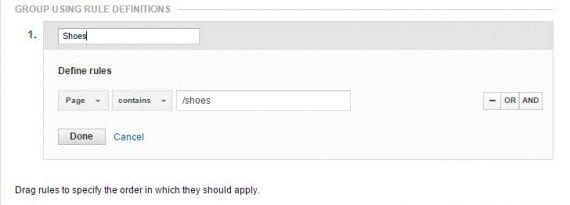
Group using rule definitions.
13. Remarketing, Audience Demographics, and Interests Report for Apps
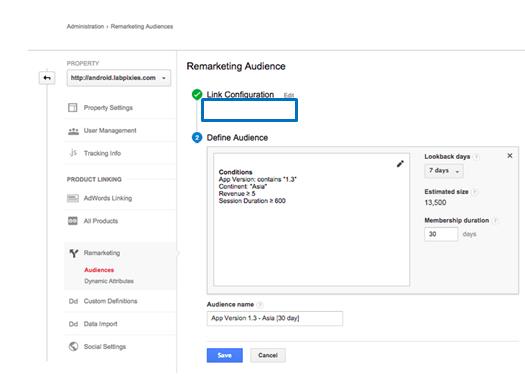
The Audience Demographics report for Apps, launched on September 17, 2014, provides insights into how different audiences engage with your mobile app. In-app audience demographics and behavior data (like web data) can now be used to create remarketing lists for in-app remarketing campaigns. Go to: Admin > Property > Remarketing > Audiences.
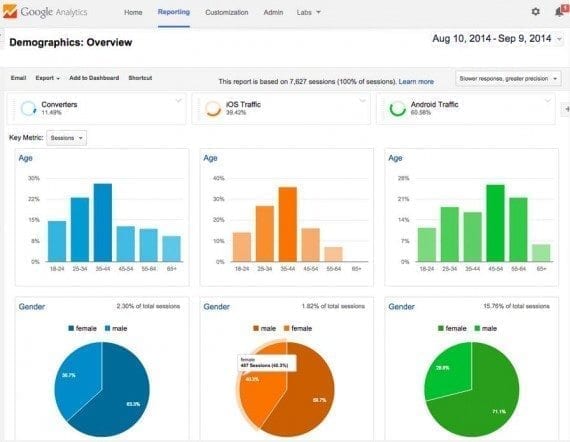
The Audience Demographics report for Apps provides insights into how different audiences engage with your mobile app.
Google has also refined segmentation and remarketing lists.
It is easier to create remarketing lists for app and web users with a new creation flow for audience setup. Marketers are also now able to import shared audience definitions via template links or from the solutions gallery.
Marketers can now import shared audience definitions.
There is a new “Display Targeting” report available in the Acquisition section. It provides AdWords campaign performance data for all your remarketing lists in a single place. Go to: Reporting > Acquisition > AdWords > Display Targeting.
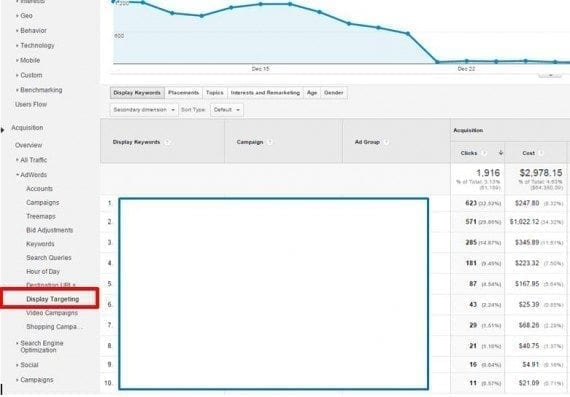
The new “Display Targeting” report provides AdWords campaign performance data for all your remarketing lists in a single place.
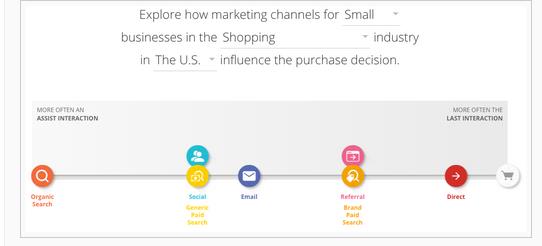
14. ‘Customer Journey to Online Purchase’ Tool
The last significant Google Analytics update of 2014 was an updated version of its “The Customer Journey to Online Purchase” tool, on December 11.
The latest version features refreshed data, and updated industry classifications. It also splits paid search to let users see the impact of brand vs. generic search terms on purchase decisions.
Google has also benchmarked customer journeys for small, medium and large businesses across a number of industries.
In the Customer Journey to Online Purchase” tool features refreshed data, and updated industry classifications.
Each marketing channel can be drilled into for a closer look at the role it plays based on its position in the purchase path. For example, Generic Paid Search, Display Click, and Direct each play different roles at particular stages.
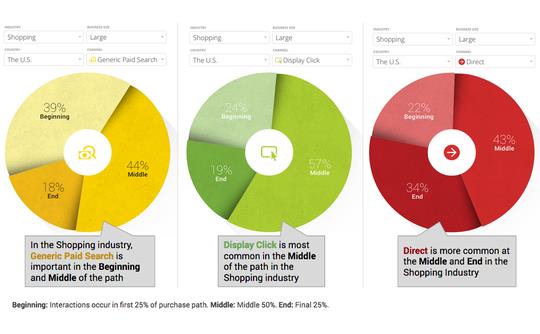
Each marketing channel can be drilled into for a closer look at the role it plays based on its position in the purchase path.
Each marketing campaign and channel can have a different impact on shoppers, depending on when they interact with it. You can use the customer journey tool to help adapt your marketing messaging to be more relevant and useful for your customers on specific channels.