In response to user feedback, Facebook has redesigned Page Insights to make it more actionable, simpler to use, and easier to understand. The new version helps Page administrators create better content and provides them with more information about the people that visit their pages.
The Insights dashboard has been divided into six tabs: Overview, Likes, Reach, Visits, Posts and People.
Overview
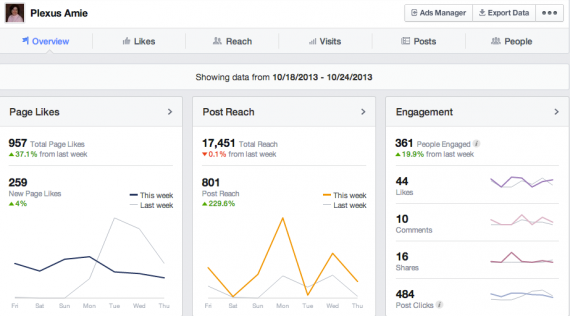
Insights Overview presents a snapshot of Page activity covering a 7-day period.
Three metrics appear at the top of the Overview tab to help admins assess the size and level of engagement of their audience. It contains a snapshot of the last seven days based on likes, post reach and engagement. It also lists the five most recent posts with information on post type, targeting, reach (organic and paid), and engagement (clicks, likes, comments and shares).
Likes
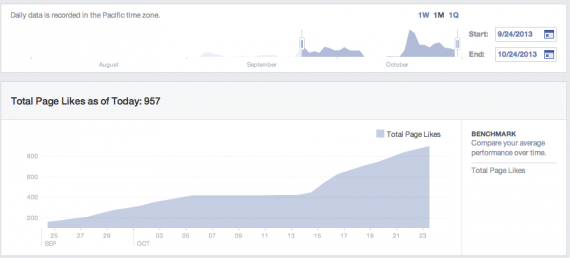
The Likes sections show total and net likes, as well as where likes came from.
This section reports the number of likes a Page has received over a period of time. Data is presented using the following graphs.
- Daily Data. Admins can view data based on preset options – week, month or quarter – or use a slider to select custom time periods.
- Total Page Likes. The total number of likes up to the present day. Admins can mouse over the graph to see total likes from past days.
- Net Likes. This graph shows unlikes, organic likes, paid likes and overall net likes, which are the number of likes minus unlikes.
- Where Page Likes Came From. The number of times a Page was liked, broken down by where it happened.
Admins can benchmark data based on those categories to compare average performance over time.
Reach
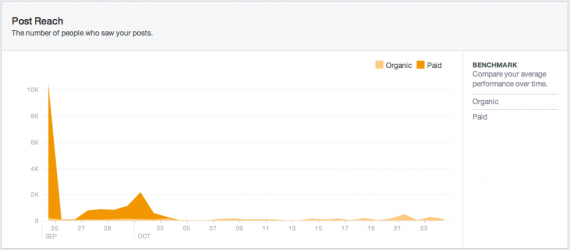
This section measures Page post level data including reach and engagement.
The Reach section records the number of people who saw Page posts over time. Data is categorized by organic and paid posts, post likes, comments and shares. Negative engagement such as hide, report and spam, and unlikes is also shown. Total post reach, which is the number of unique people who have seen any content associated with a Page during the last seven days, is also measured.
Visits
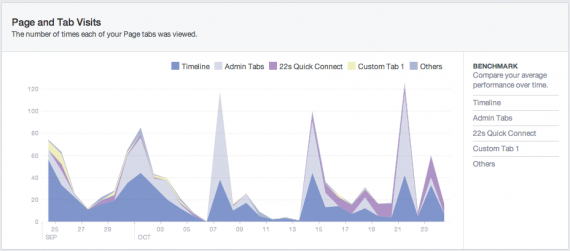
This section shows visits to the Page and to tabs.
This metric is comprised of Page and tab visits and reveals the number of times each of the Page tabs were viewed. Other page activity and external traffic referrers are also reported.
Posts
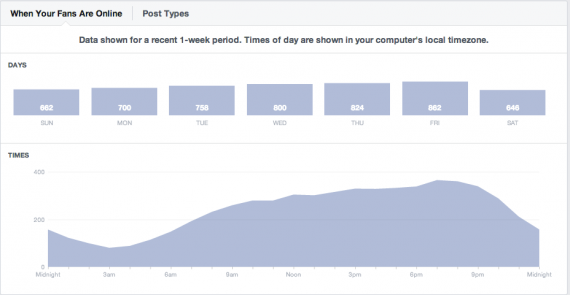
Admins can see when fans are online by day of week and time of day.
Two graphs are presented in this area. The first shows when fans are online by day of the week and time of day. Post types reveal the success of different post types based on average reach and engagement. It also includes a list of all posts published in chronological order and shows reach and engagement data.
People Reached
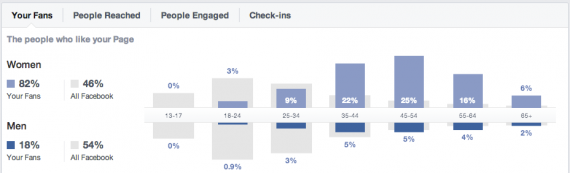
The People section provides demographic data on Page visitors.
This measures anyone who has interacted with the Page including Fans, total people reached, people engaged and check-ins. Demographic data is presented that contains gender, age and location information.
New Export Function
Facebook updated its expert function to coincide with the new version of Insights.
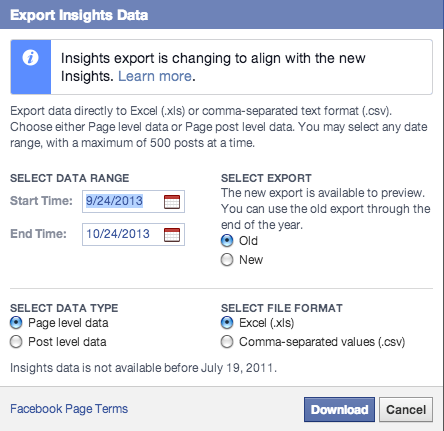
The export function was updated to coincide with the new version of Insights.
Admins can export data directly to Excel (.xls) or comma-separated text format (.csv). They can also choose either Page level data or Post level data. Any date range can be selected, with a maximum of 500 posts at a time.
New Feature: Pages to Watch
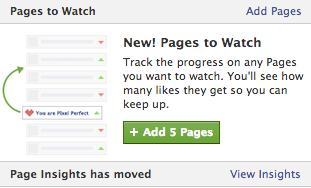
Admins can monitor up to five other Pages.
Facebook now enables Page admins to track the progress of up to five other Pages. When selected, Facebook bookmarks these Pages in the module and provides update about like totals over the past 7-day period. No deeper metrics are available at this time.
Pages that are being watched receive a notification, which includes an invitation to try the new feature.