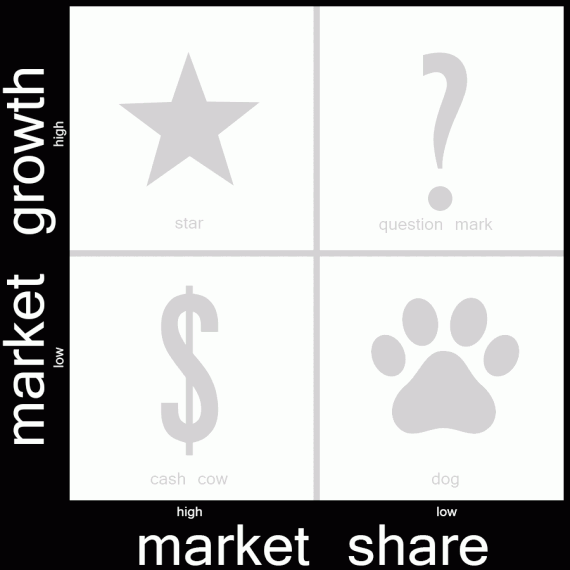
Designed to analyze product lines, the Boston Consulting Group (BCG) Matrix or growth-share matrix can help ecommerce business owners and marketers decide which products or product categories will likely generate the best return on investment from marketing and promotion.
Online retailers, particularly those with a number of product or product lines, daily make decisions about which products to promote, and which items don’t get advertising or marketing investments. Unfortunately, many small businesses use “gut feelings” or simple sell-through rates to make marketing investment decisions, potentially missing out of on stellar opportunities.
Bruce Doolin Henderson, the one-time president and CEO of BCG, developed a two-dimensional grid to help companies decide how to allocate resources to various product lines. In its original context, it is aimed at manufacturers, but marketers have adopted the BCG as a way to think about allocations not just for products manufactured but also for products retailed.
What the BCG Matrix Measures
The BCG Matrix looks at two variables, if you will, aimed at helping decision makers understand how a manufacturer’s or a retailer’s particular position with a product or product category fits into the market.

The BCG Matrix looks at two variables: market share and market growth.
First, the BCG considers market share, which is the percentage of the overall market that the company, or in the case of ecommerce the retailer, controls.
Small business owners or marketers at a relatively small company may feel like they don’t really know what their store’s market share is or even how to find it, but this percentage can be discovered with a little bit of research.
Try looking, as an example, at the filings for publicly traded retailers or manufacturers that sell or make the product in question. These companies frequently provide market share data to investors and analysts, and small businesses can use a larger competitor’s market share to calculate its own.
The calculation might go something like this. If Amazon says that it has a 50 percent market share of online envelope sales, and it reports $10 million in online envelope sales, one can estimate that the total online envelope market is about $20 million. If your business sells $1 million worth of envelopes online in a year, you have about a 5-percent market share.
You might also look for reports from government agencies or publications too. Various government agencies post market data as do industry publications. A Google or Bing search can find data that nearly any merchant can use to discover market share.
Finally, there are services that will help identify market size. As an example, a merchant could use Terapeak’s tools to learn the size of the market for a particular product on Ebay.
The key here is that the BCG Matrix assumes companies with a relatively high market share are also relatively successful.
The second dimension or variable in the BCG Matrix is market growth. This is the percentage that the market is expanding over a set time period. When markets — or the demand for a product or product category — are growing quickly it is usually an indication of opportunity.
Low growth markets or product lines tend to have more or greater competition. The pie, if you will, is a fixed size and everyone has to fight to get a piece. But high growth markets tend to have relatively low competition and relatively more opportunity. The pie itself is getting larger and just being in the market implies you’ll get a larger piece eventually.
Ecommerce owners and marketers can look to published reports and industry analysis to identify market growth rates for use in the BCG Matrix. There are also third-party tools that track sales rates and average selling prices for markets. This can again be used to gauge market growth.
Plotting Products or Product Categories
For each product line that an online sellers stocks, that seller should try to identify, at least annually, market share and market growth and plot each product line on the BCG Matrix.
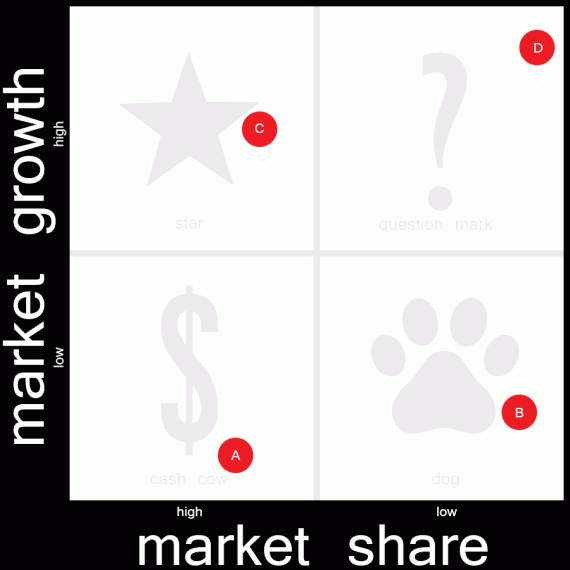
As an example, if a merchant has the follow products these items could be plotted on the BCG matrix in relative positions.
-
Product A. 35-percent share, 10-percent growth
-
Product B. 5-percent share, 15-percent growth
-
Product C. 30-percent share, 65-percent growth
-
Product D. 2-percent share, 95-percent growth
The process of plotting the products will place them in a quadrant. Product A would be in the lower left quadrant with low growth but relatively high market share. Product B would be in the lower right quadrant with low growth and low share. Product C would be in the upper left quadrant with relatively high market share and growth. Finally, Product D would be in the upper right quadrant with low market share, but high growth.

Each quadrant on the BCG Matrix represents a certain kind of business situation and a specific strategy that should impact how a business invests marketing funds.
In the BCG Matrix the lower right quadrant is called the “Dogs.” It describes a product or product category for which a company has low market share and is constrained with low growth.
The Dogs
Products in this quadrant should, generally, either receive no support or be divested — i.e., closed out.
The reasoning is that competing here will take a significant investment in time and money since the company has low market share and must take sales away from competitors who may be better positioned in the market. Think about the folks who sell mass-market products on Amazon or Ebay, wherein the only real way to compete is to keep slashing prices, lowering margin, and making less money for the same amount of effort.
The Cash Cows
Products in the lower left quadrant are called “Cash Cows.” In these instances the company has relatively good share of the market, but is faced with low growth. These are products that are money makes, but they will not necessarily take the seller further, growing revenue or profits over time.
Here the strategy is to harvest from these products to invest elsewhere. Take advantage of success, but don’t rest.
The Question Marks
With high growth and low market share, products in the upper right are referred to as “Question Marks.” Businesses simply don’t know what they represent in terms of possible market share or growing profits.
In spite of the unknowns, you want to build promotions for these items, investing in advertising and promotion.
These products have the greatest potential for the business since there is an opportunity to capture share and to grow with the market. Just know that not every “Question Mark” product will be successful.
The Stars
A company’s “Star” products reside in the upper left quadrant with high market share and high growth. Because of the company’s relatively strong market share the company has a good competitive position. The high growth also means that there is the opportunity to continue to increase revenue and profits.
For “Star” products, hold on to what you have or in some case try to continue to grow, but this is really an area of moderate marketing and advertising investment.
Marketing Investments
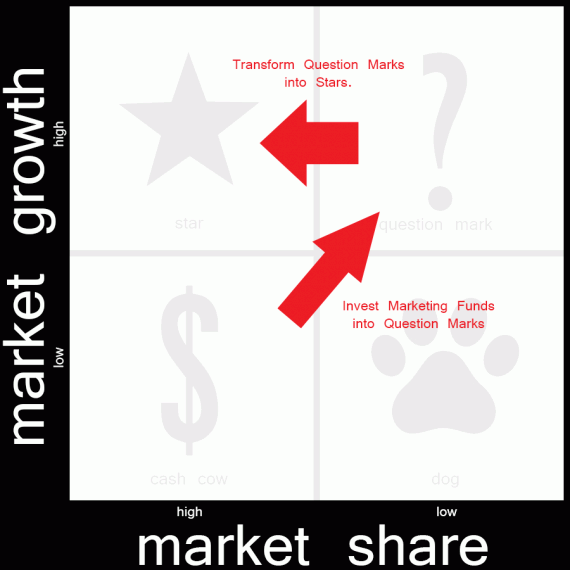
When you use the BCG Matrix to make marketing investment decisions, the goal should be to create star products and hold on to them. Thus, you are going to allocate some marketing and advertising to holding on to stars and the rest to star creation.

The BCG Matrix consists of four quadrants, to help make marketing decisions.
Money from dogs and cash cows should be invested in question marks with the aim of transforming some of those question marks into stars. In the case of dogs, this may mean not investing at all. For cash cows, you will either hold or harvest.


