Picture a potential customer working in his backyard. He opens his iPhone to search for “garden hose reel.” Unfortunately, there are no cell phone towers nearby with fast 4G connections. Thus his internet connection is painfully slow.
Google’s search page loads quickly because it automatically optimizes pages for slow 3G connections.
Among the first organic results is a page from Lowe’s and another from The Home Depot. He decides to open each link in separate browser tabs to compare the options.
Let’s take a close look at the speed of each page. How fast are they?
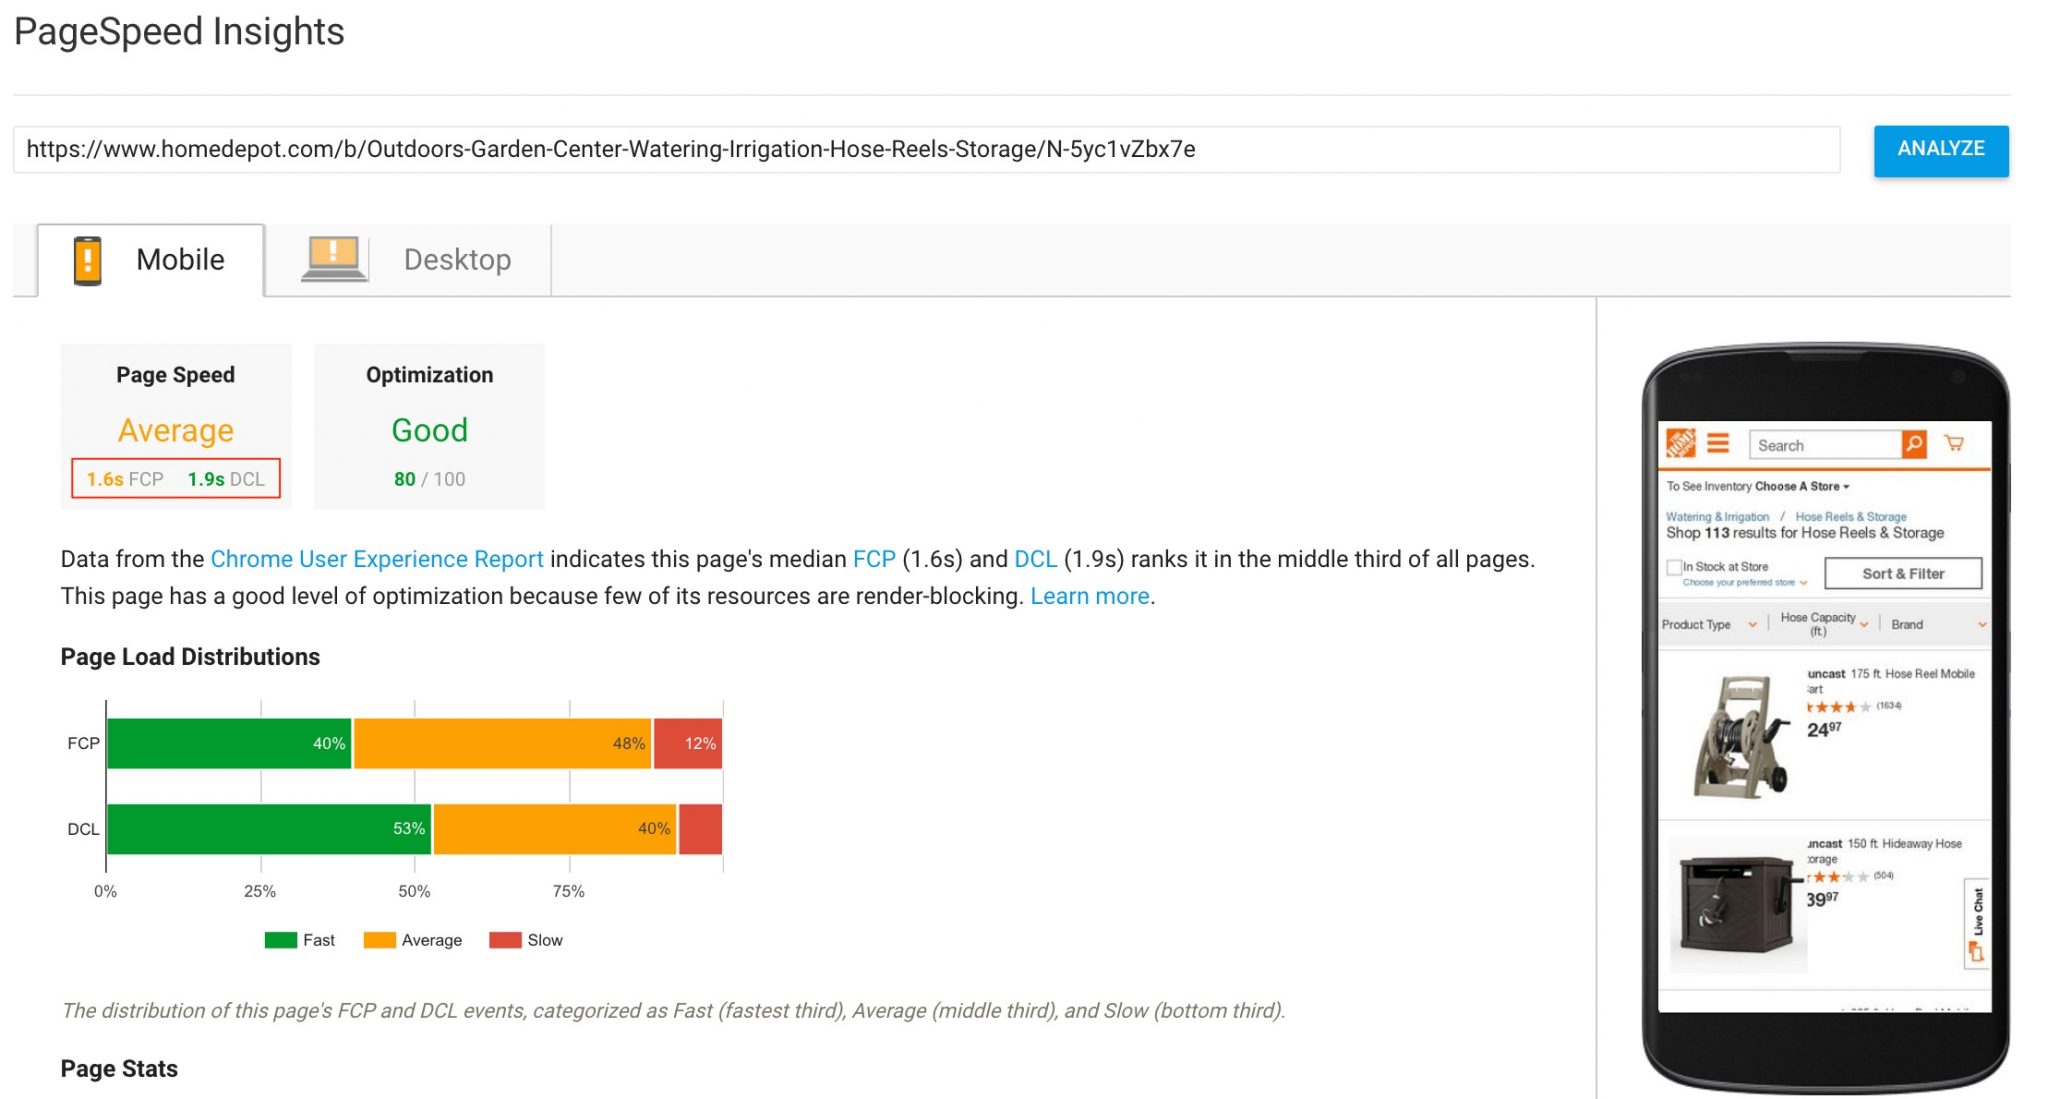
Page speed report for The Home Depot from Google’s PageSpeed Insights. Click image to enlarge.
—
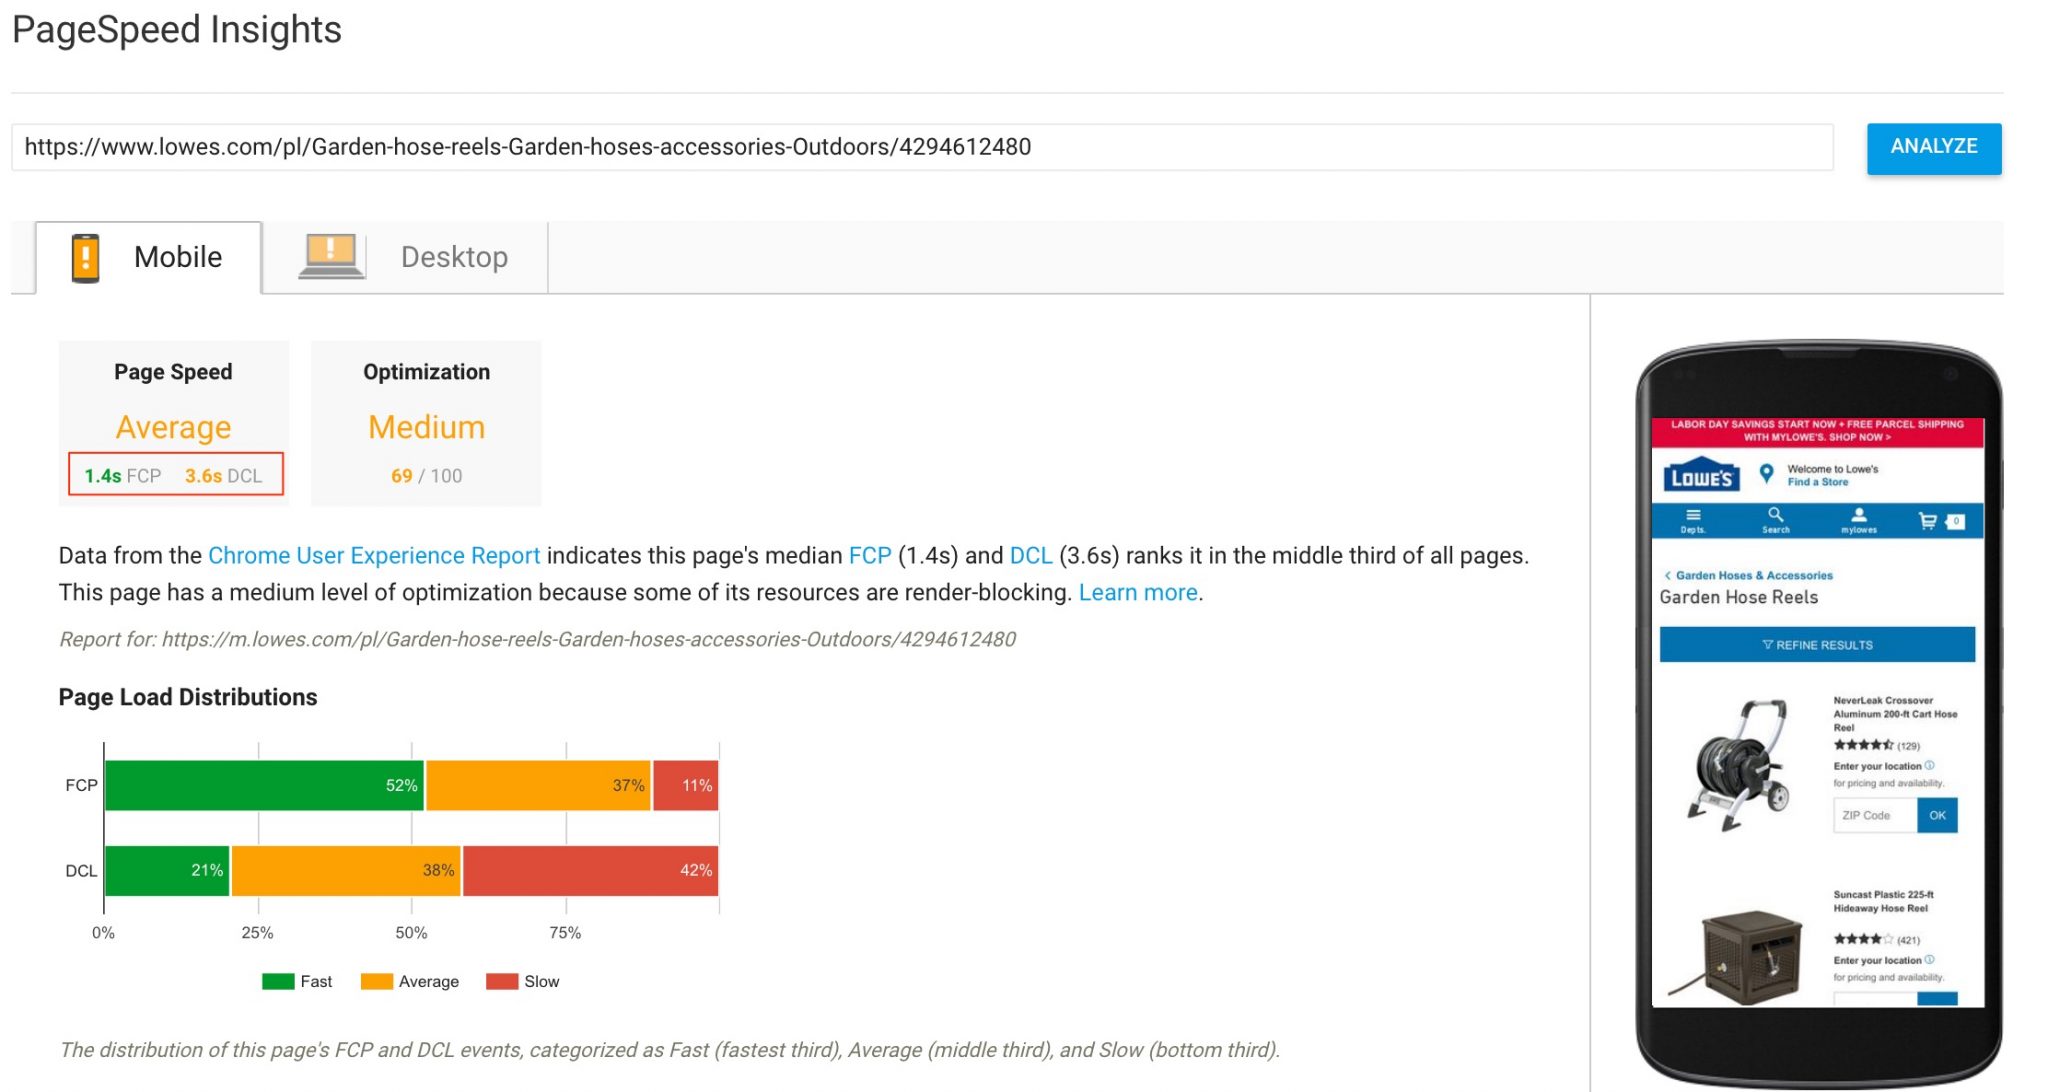
PageSpeed Insights report for Lowe’s. Click image to enlarge.
When we compare the average load times using PageSpeed Insights, Lowe’s wins on FCP (First Contentful Paint — when a user sees a visual response from the page), at 1.4 seconds versus 1.6 seconds for The Home Depot. This means a Lowe’s visitor is more likely to interact with the page.
However, when we look at DCL (DOM Content Loaded — when the HTML document is loaded and parsed), we see 3.6 seconds for Lowe’s versus 1.9 seconds for The Home Depot. This is a more significant difference and can produce a much lower bounce rate for The Home Depot. Google explains the concepts behind this model at its “Web Fundamentals” portal.
While the pages for Lowe’s and The Home Depot could load very fast on average, that doesn’t mean they load fast for visitors on slow connections.
I’ll illustrate this using Chrome Developer tools to browse the pages under a simulated (and slow) 3G connection. Home Depot’s DCL is at 8.44s for a 3G connection.
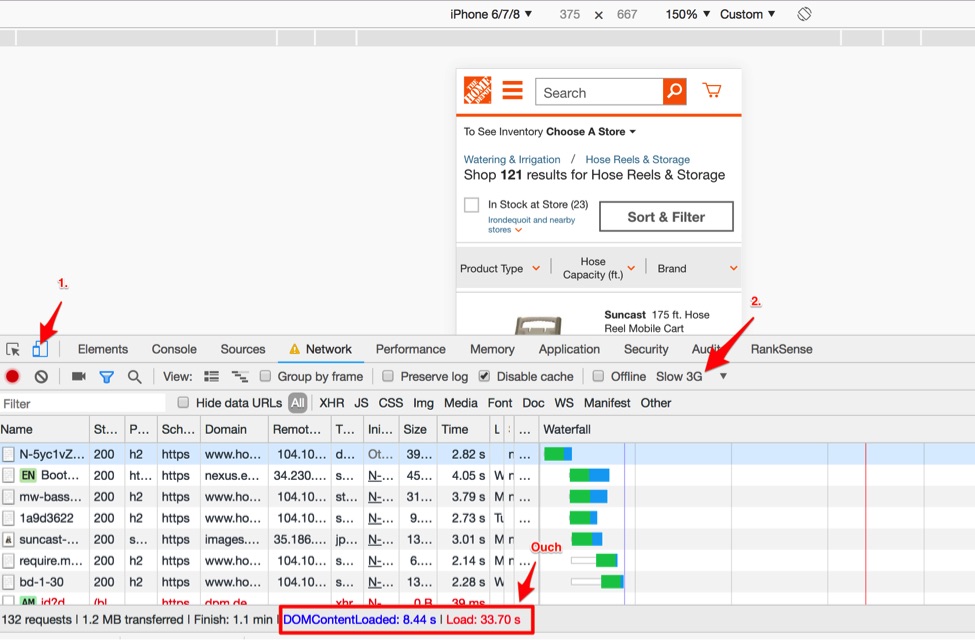
Chrome Developer Tools reports Home Depot’s DCL at 8.44s for a simulated 3G connection. Click image to enlarge.
—
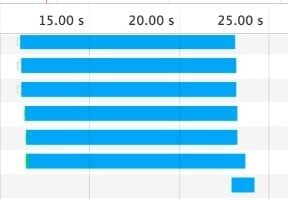
Lowe’s DCL for a 3G connection is 19.02 seconds. That is roughly twice as slow as Home Depot’s! (We can imagine our friend doing additional gardening work while the pages load.)
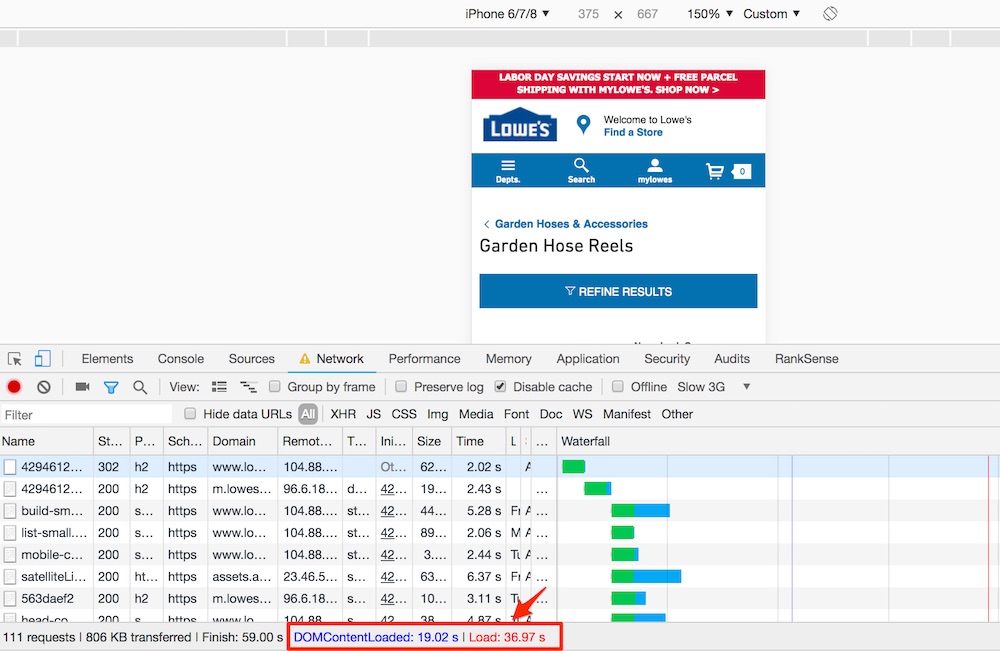
Lowe’s DCL for a 3G connection is 19.02 seconds, which is more than twice as slow as Home Depot’s. Click image to enlarge.
Even if you have a fast loading site as measured by a high-speed internet connection, a good portion of your potential customers could be on slow connections. Your site could load slowly for them.
A content delivery network can help pages load faster for users in different geographical locations, but it won’t help users with slow connections.
Page Speed for Slow Connections
How to speed up your site for slow mobile connections?
A responsive design that automatically adjusts based on the connection speed would be an ideal solution. Unfortunately, browsers don’t support this capability. Chrome and Firefox have an experimental API for this, but it is not something to have in production.
An approach that works for sure is to have a separate site for slow connections. If you have ever had issues with Gmail loading, you may have seen the link to switch to the basic HTML version. The trick is to have a beacon image that tracks how long the page is taking to load. Once it exceeds a threshold, an alert should appear inviting the user to the alternative version of the website.
But developing and maintaining another version of your site could be prohibitively expensive. We can determine if it’s worth the money for The Home Depot and Lowe’s by checking what percentage of their users are coming from slow connections.
Chrome User Experience Report
Google Analytics does not break down site visitors by connection type. That feature was removed a long time ago.
Fortunately, Google maintains a public dataset called the Chrome User Experience Report — CrUX — that has this information for many popular sites. It is the same data that powers PageSpeed Insights. But CrUX aggregates by domain and includes many more metrics and dimensions that allow for more advanced analyses.
CrUX is available in Google’s BigQuery, a web service for analyzing huge amounts of data. (As an aside, it recently added “Country” as a dimension to query.)
Paul Calvano of Akamai produced a very helpful tutorial to analyze CrUX data in BigQuery. We can adapt it compare the slow connection speed distributions of Lowe’s and The Home Depot. The distributions will provide the percentage of site visitors on slow connections. The breakdown will help determine if either company should invest in a separate website.
Step 1. Create a new project in Google Compute Engine to access the CrUX data from BigQuery
Step 2. Run an SQL query to perform the comparison. Save the results to Google Sheets for further analysis.
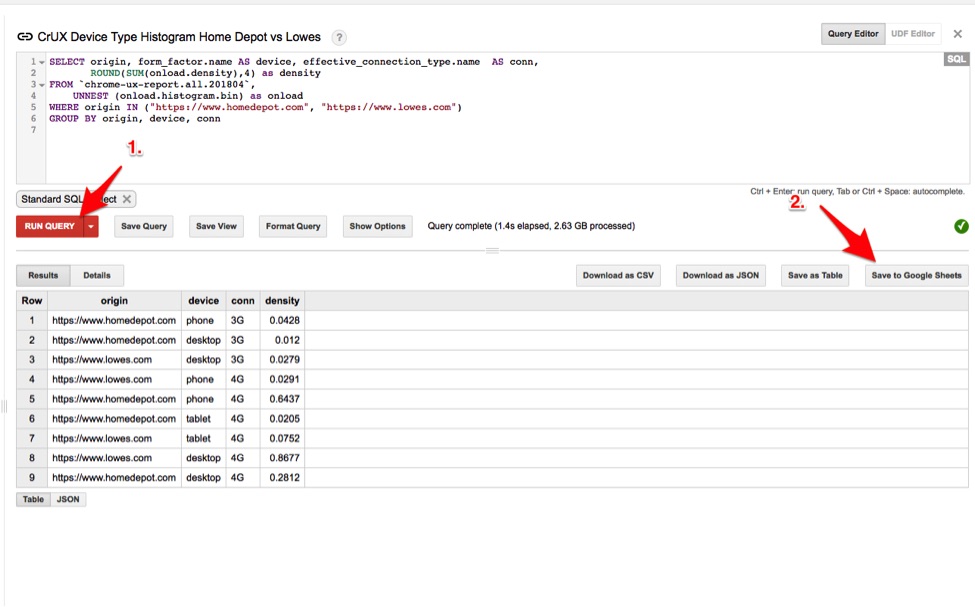
Run an SQL query to compare slow connections for visitors to Lowes.com and HomeDepot.com. Save the results in Google Sheets. Click image to enlarge.
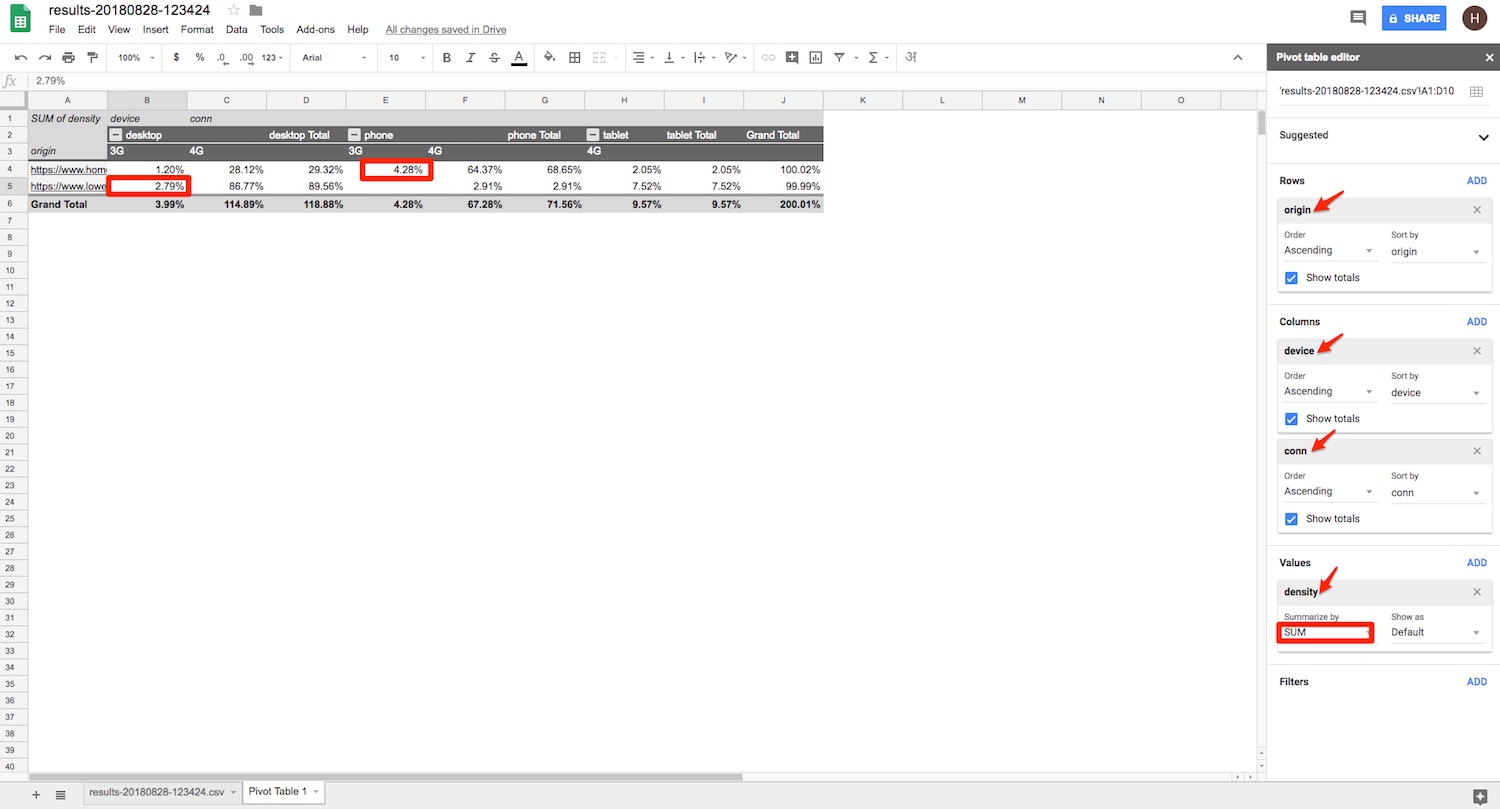
Step 3. In Google Sheets, create a pivot table to organize the data at Data > Pivot Table. A configuration window opens on the right side. Select “origin” as the rows, “device” and “conn” as the columns, and then “SUM” for the density. Then confirm that the grand totals on the sheet are 100 percent.
In Google Sheets, create a pivot table to organize the data at Data > Pivot Table. Click image to enlarge.
According to this report, 2.79 percent of visitors to Lowes.com uses a slow connection from desktop computers, but no significant percentage from mobile devices. However, for The Home Depot, 4.28 percent of visitors on mobile devices are on slow connections, compared to 1.20 percent of desktop users.
For companies of the size of The Home Depot and Lowe’s, single digit percentages can represent a lot of visitors (and money). For The Home Depot, 4.28 percent could make business sense.
If you compete with HomeDepot.com, Lowes.com, or other companies that underperform for slow connections, this might be an opportunity for you to replicate your site specifically for those visitors.
As you experiment with the Chrome User Experience Report to find more competitive advantages, consider these helpful resources:
- CrUX Cookbook in GitHub includes a list of helpful SQL queries.
- CrUX Search lists the domains included in the CrUX.
- Standard SQL Query Syntax lists the syntax supported by Google BigQuery.
Recommended

Remembering Hamlet Batista
February 8, 2021