We’ve addressed the importance of load times for search engine optimization, most recently at “SEO: Google to Make Mobile Speed a Ranking Factor,” from fellow contributor Jill Kocher. Certainly page speed is critical, especially for mobile search visitors. But beyond SEO, page speed is important for conversion rates and overall engagement.
A Think with Google research article, “Why marketers should care about mobile page speed,” concluded that complex pages — pages with many page elements and images — have lower conversion rates and, also, that slow pages have higher bounce rates.
Thus there are good reasons to improve your online store’s page speed, especially for mobile. However, I’ve found that improving speed can require a lot of expensive developer work — usually following standard best practices over many months.
In this article, I will share simple tricks to eliminate seconds of page load time, in just a few hours.
Page Requests Waterfall
Here is a fun exercise. Let’s review the page load time from one of the slowest ecommerce sites, Gap.com. The Gap desktop home page takes 15-20 seconds to load, even on a fast 130 Mbps connection. The mobile home page is twice as slow as the desktop version.
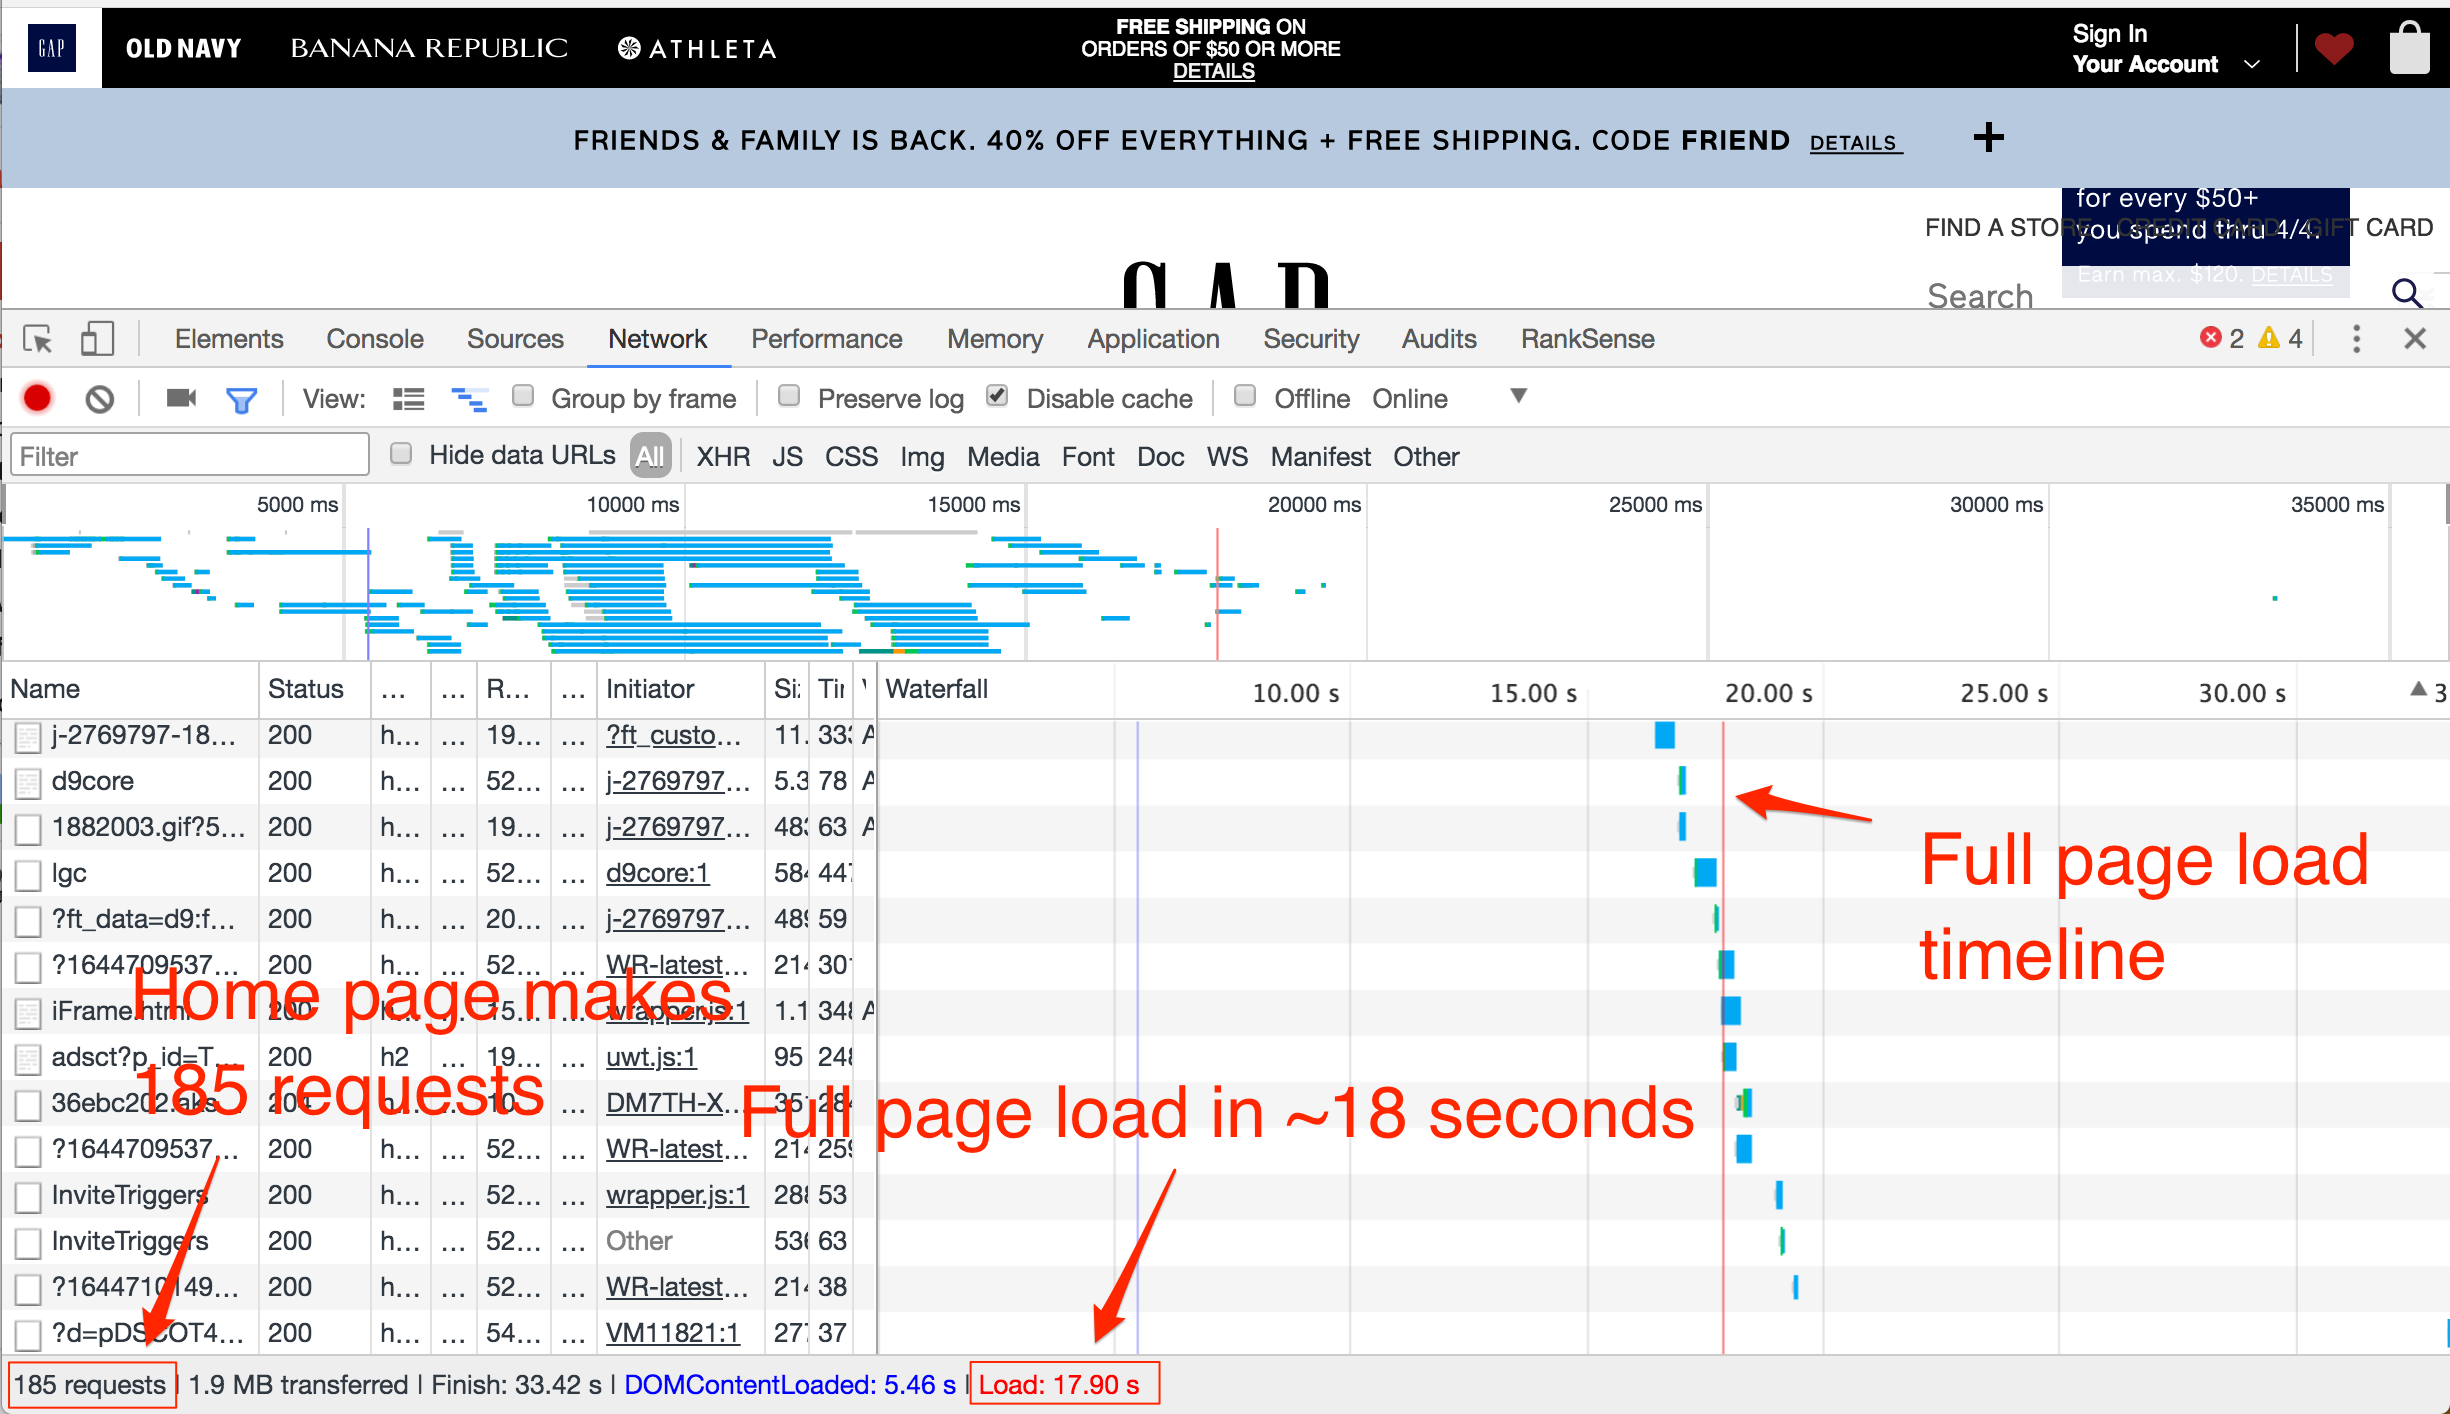
The Gap desktop home page takes 15-20 seconds to load, even on a fast 130 Mbps connection.
—
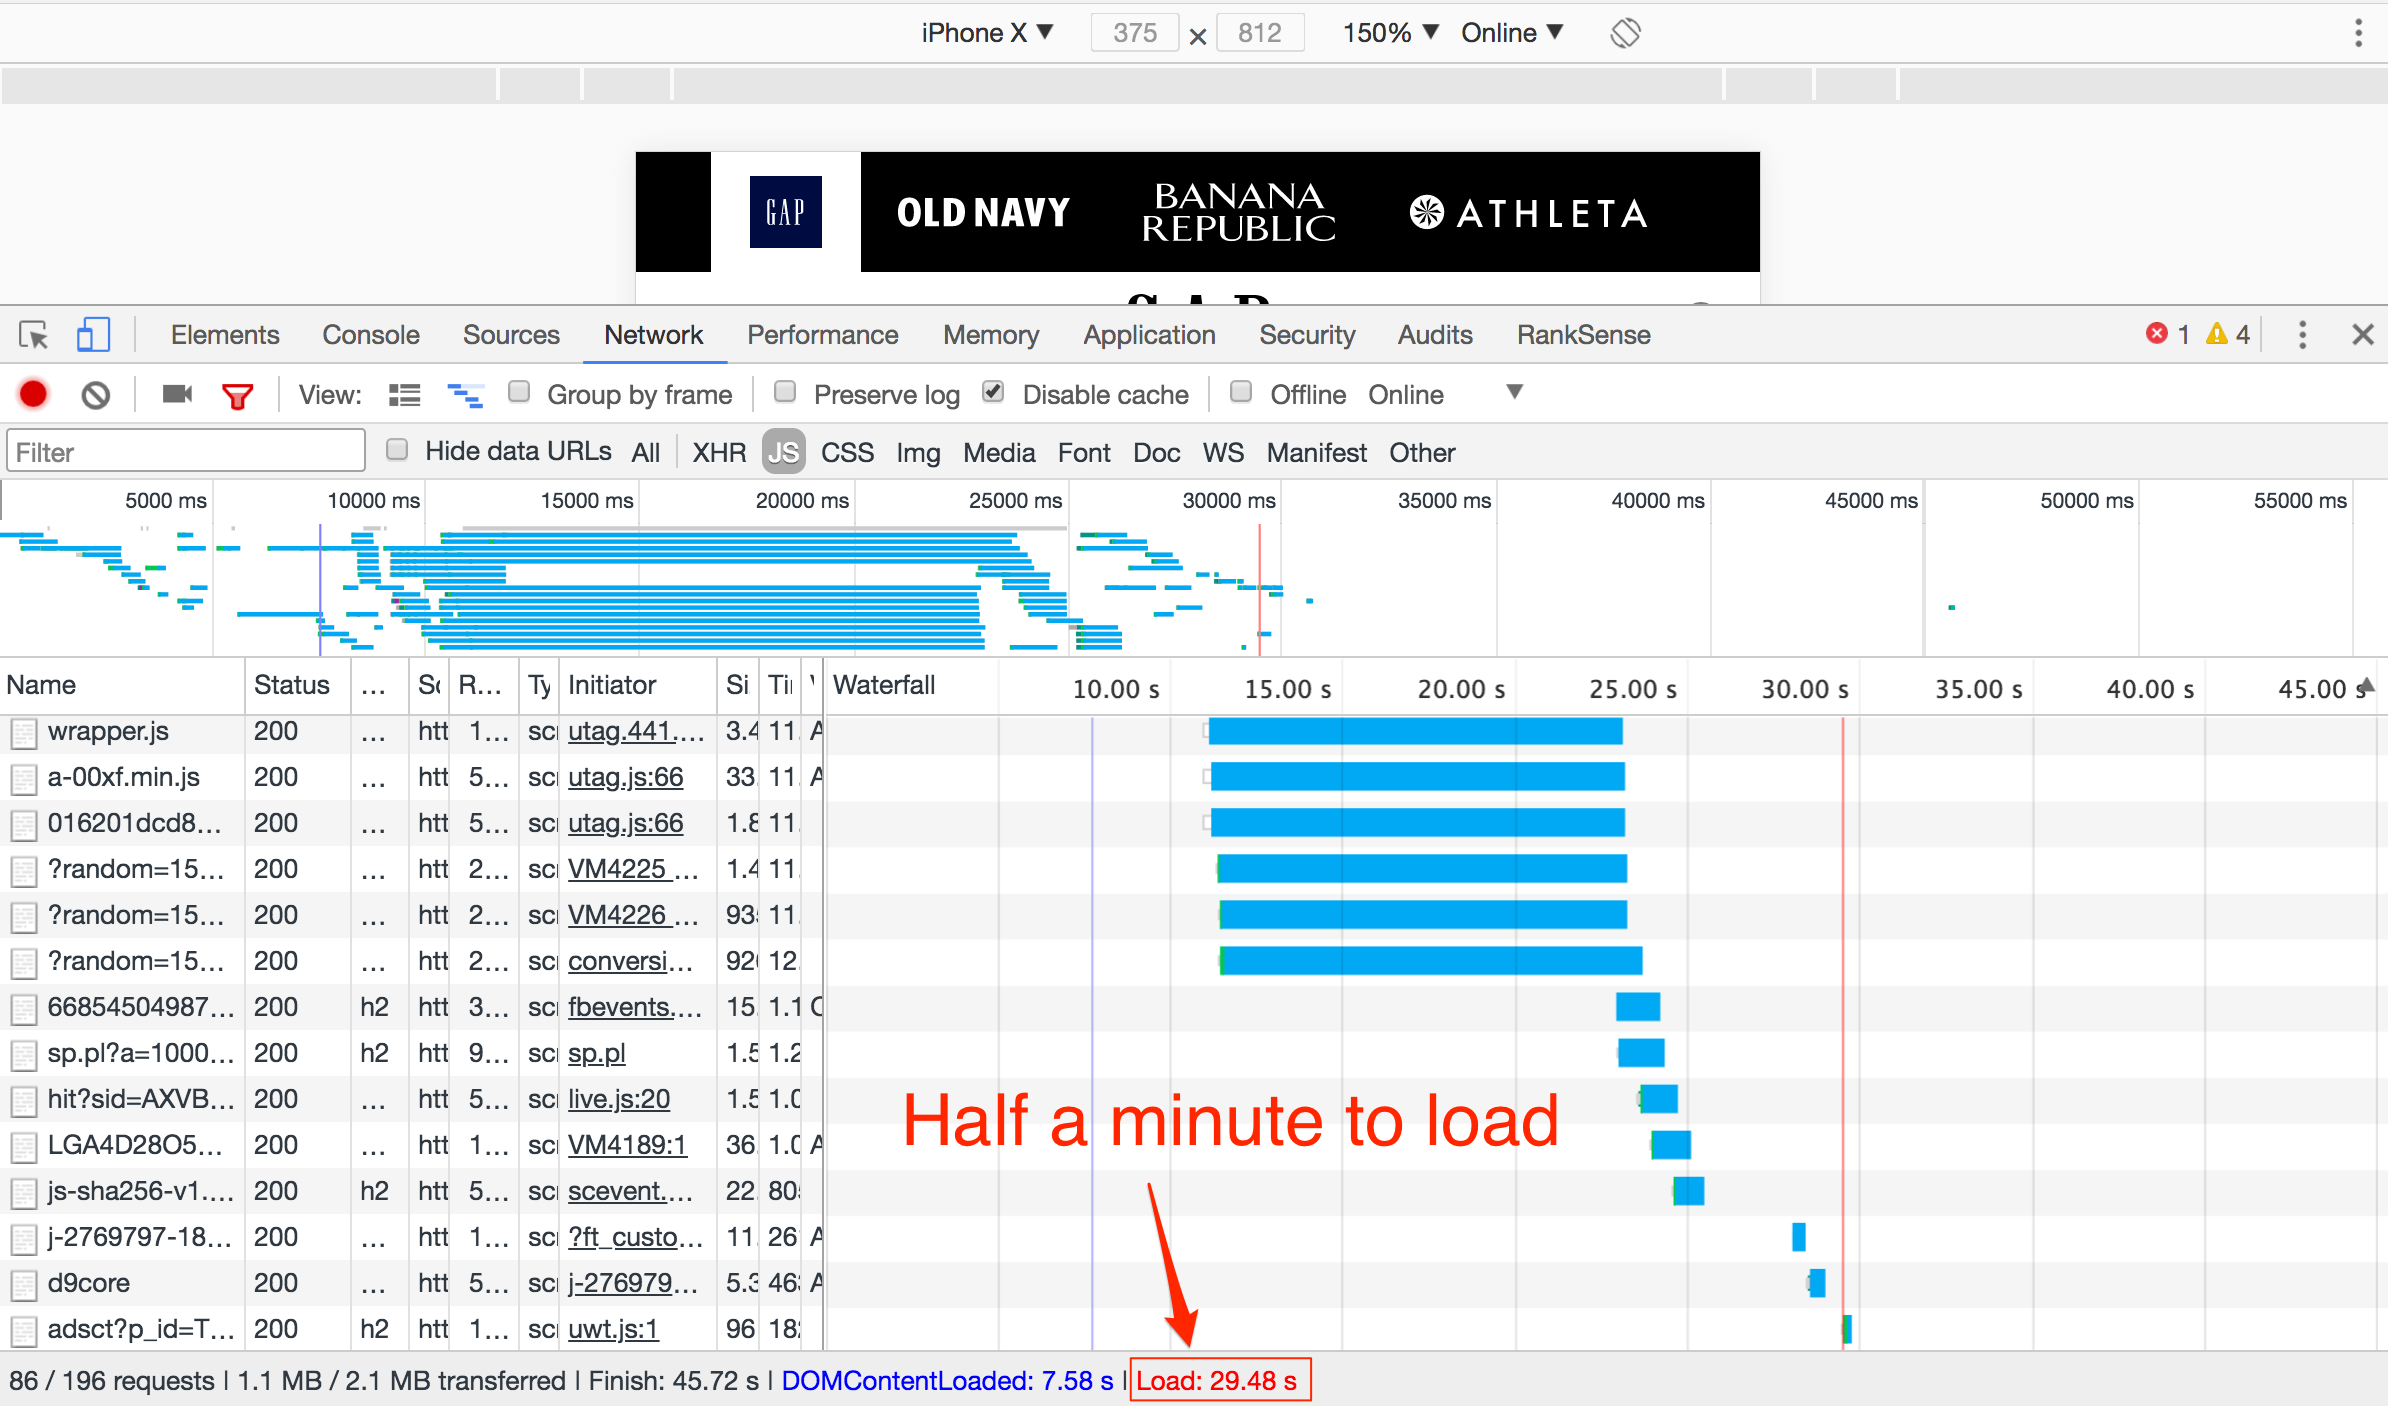
The mobile home page for Gap.com is twice as slow as the desktop version.
When it encounters a site, a web browser receives the equivalent of a jigsaw puzzle. It first receives the HTML source with the page’s “assembly instructions.” Then, every image, font, style sheet, and tracking pixel requires additional requests. Each one potentially adds to the page load time, if they don’t load in parallel.
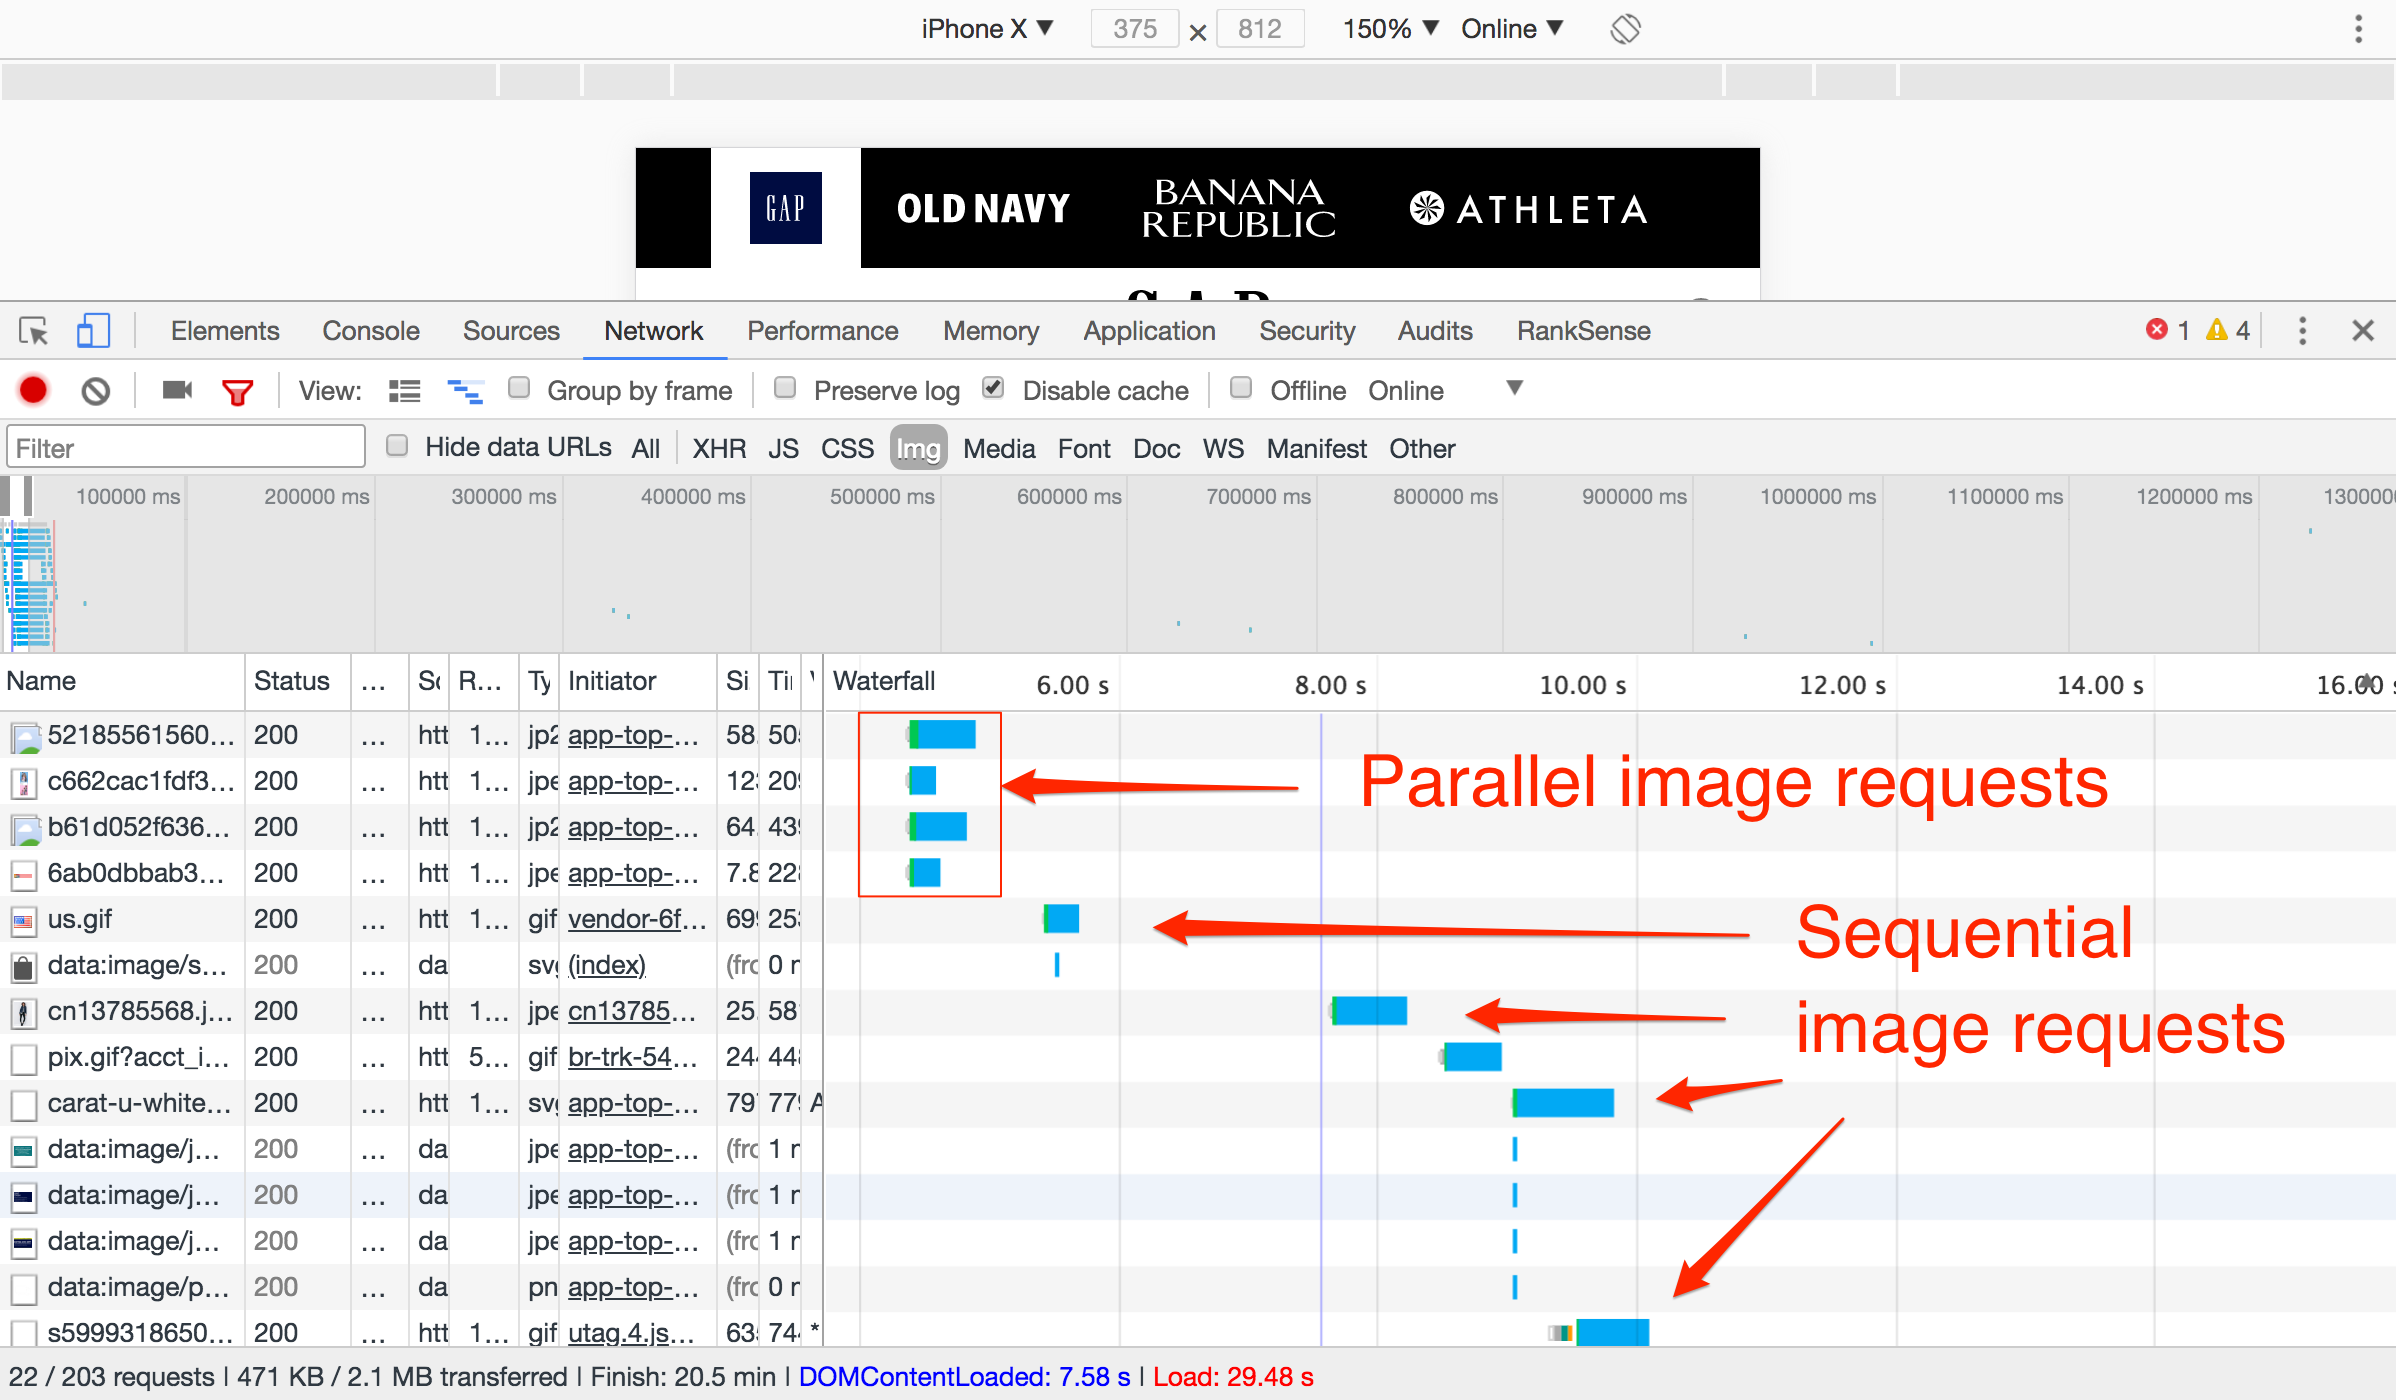
Image requests loading sequentially are causing the Gap mobile page to load very slowly.
The waterfall visualization in Chrome developer tools is a good way to identify which resources are holding back the page load time. Images and scripts are the frequent causes.
Generally, page speed recommendations focus on reducing the size of the images, which in the image above affects the size of the light blue band. But simultaneous image requests have a greater impact on page load performance.
However, in the case of the Gap mobile site, it is the third-party scripts that are causing the biggest slowdown. Those scripts add more than 12 seconds to the page load!
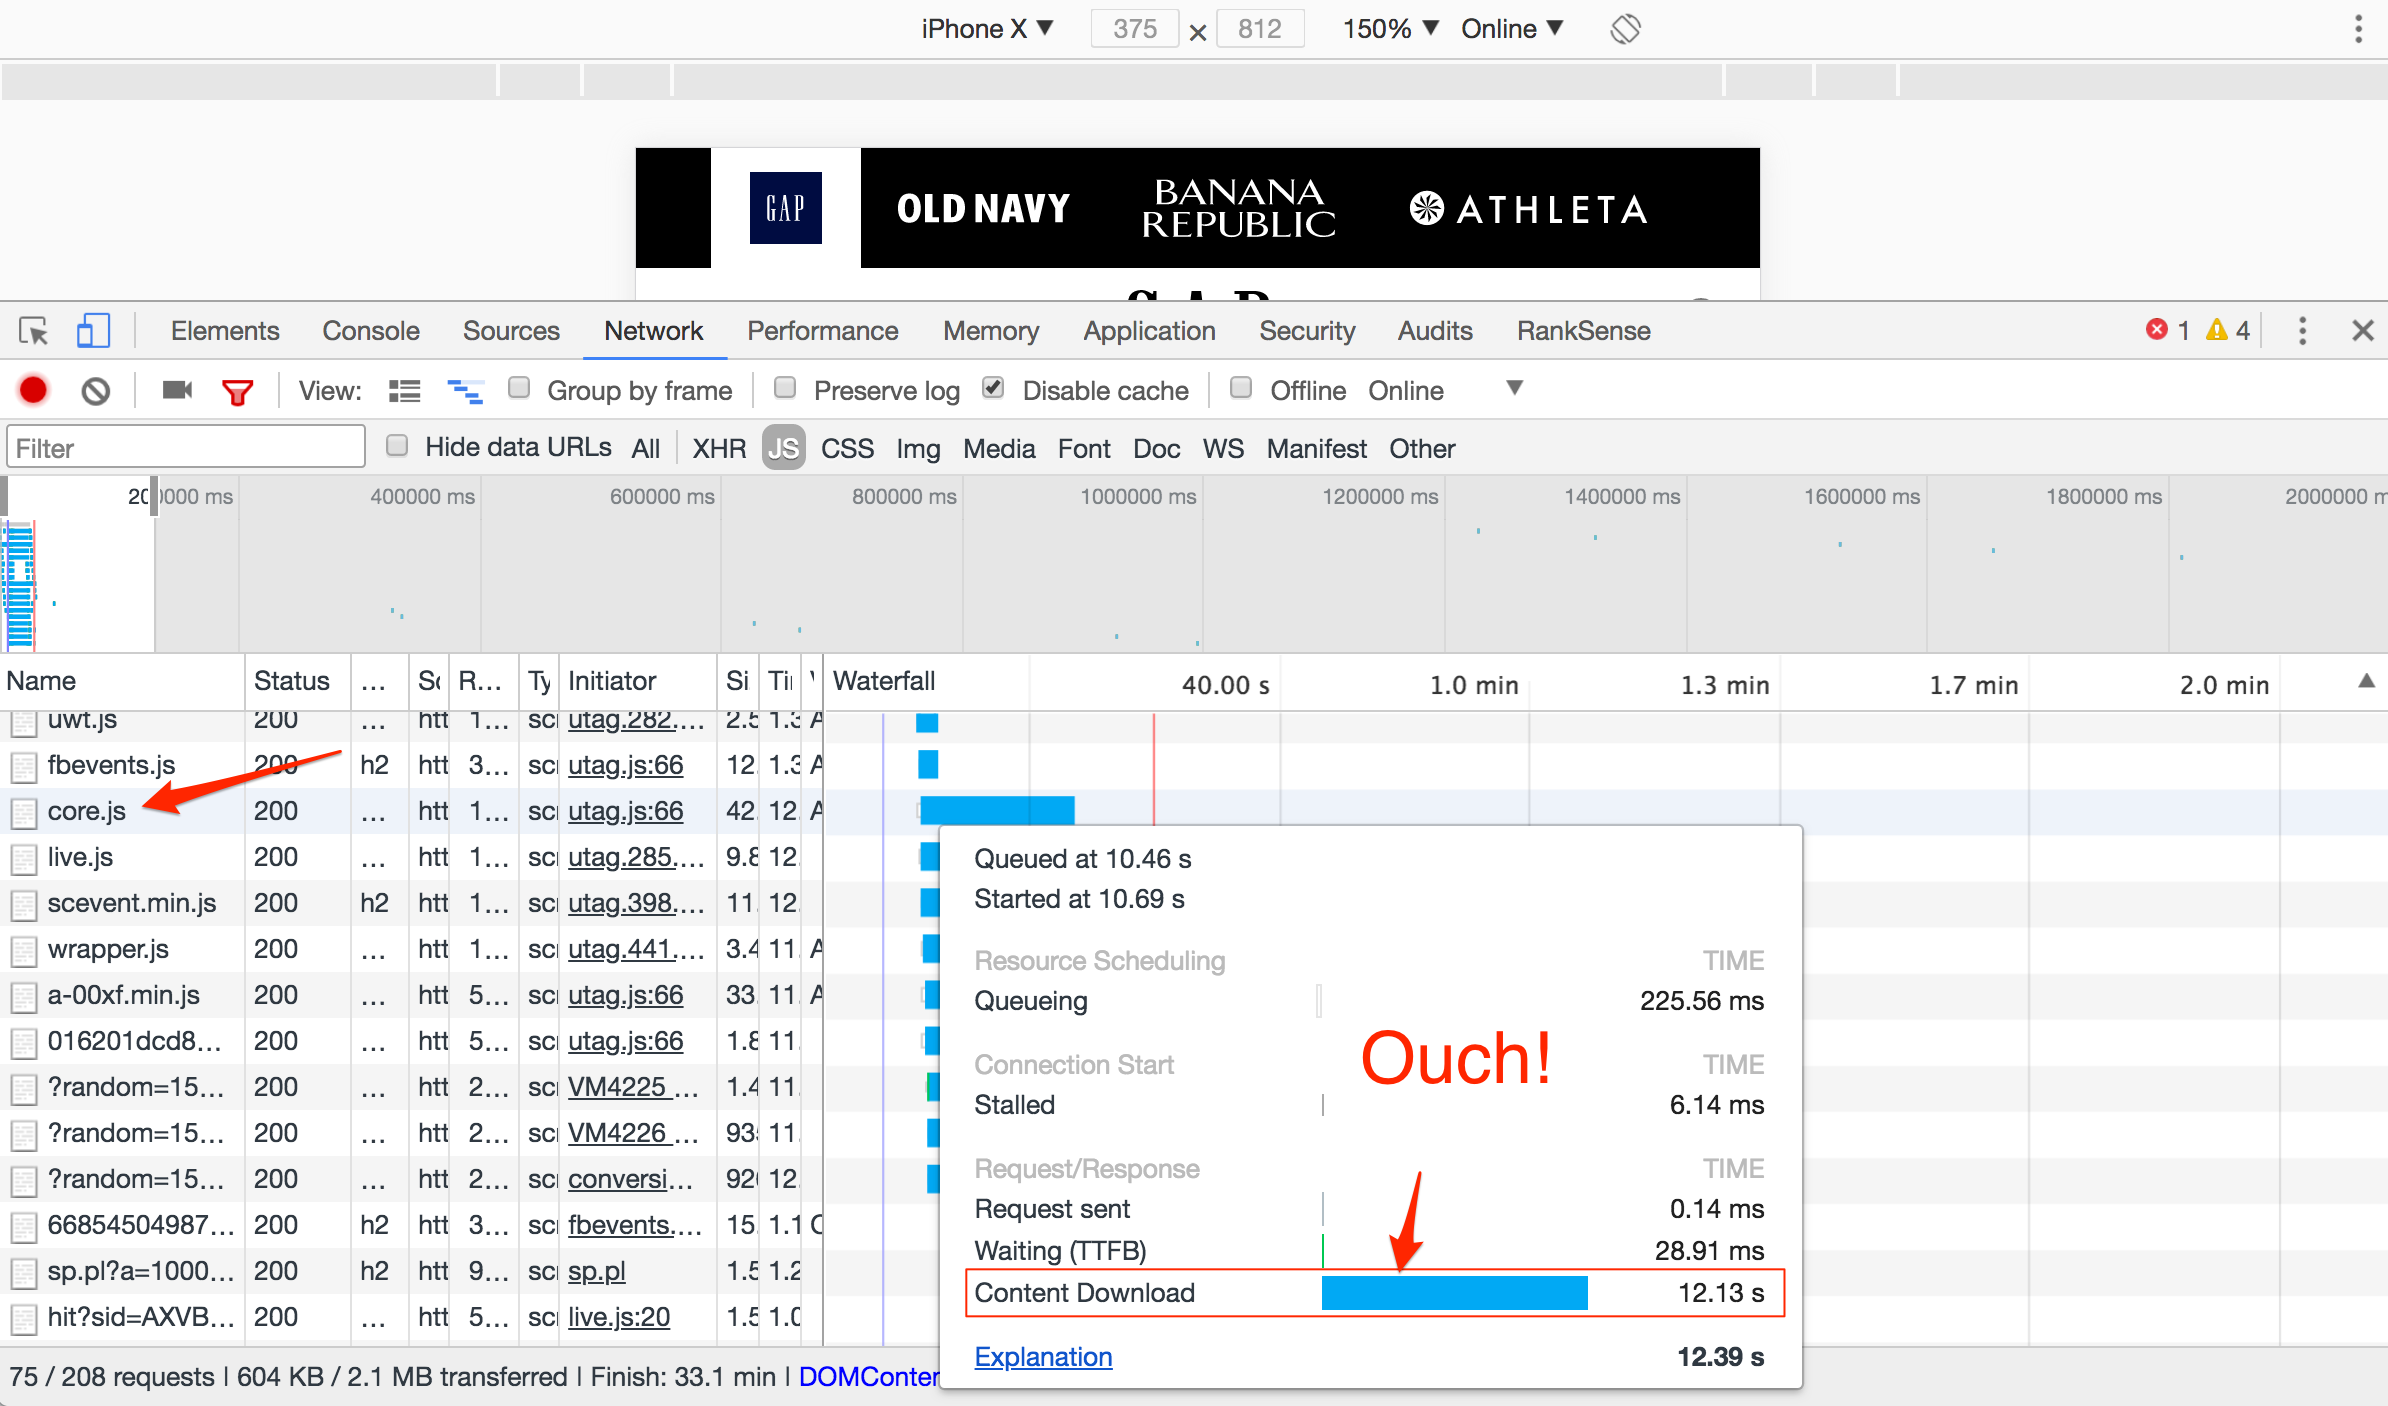
For Gap.com, third-party scripts contribute to the biggest slowdown.
Simulating Speed
Let’s use Google Chrome to simulate a faster site, while also helping our friends at The Gap prioritize page speed development efforts.
Step 1. Label third-party resources in Chrome. In the Chrome Developer Tools Network tab, press the keyword combination: Command + Shift + P, and search for “Show third party badges.”
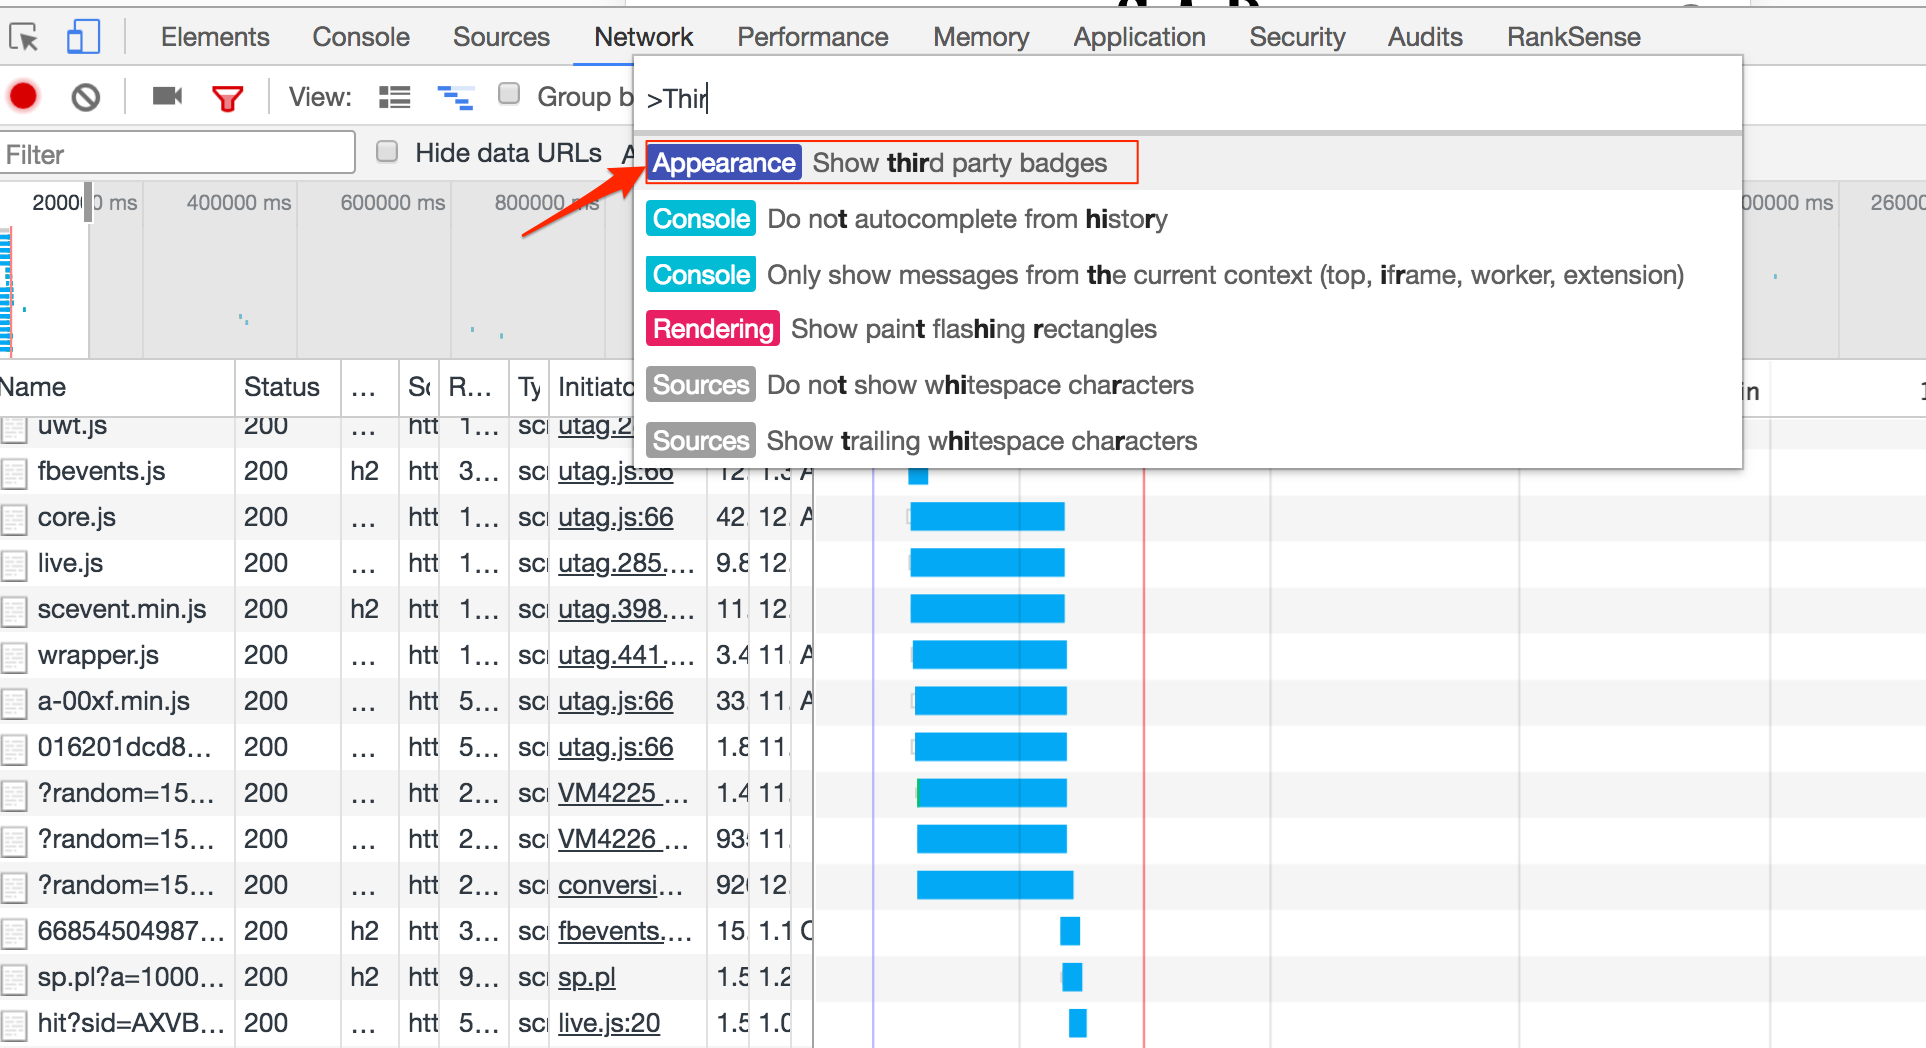
In the Chrome Developer Tools Network tab, press the keyword combination: Command + Shift + P, and search for “Show third party badges.”
—
Chrome will add colored badges next to each resource from a third-party site. Mouse over to learn the vendor.
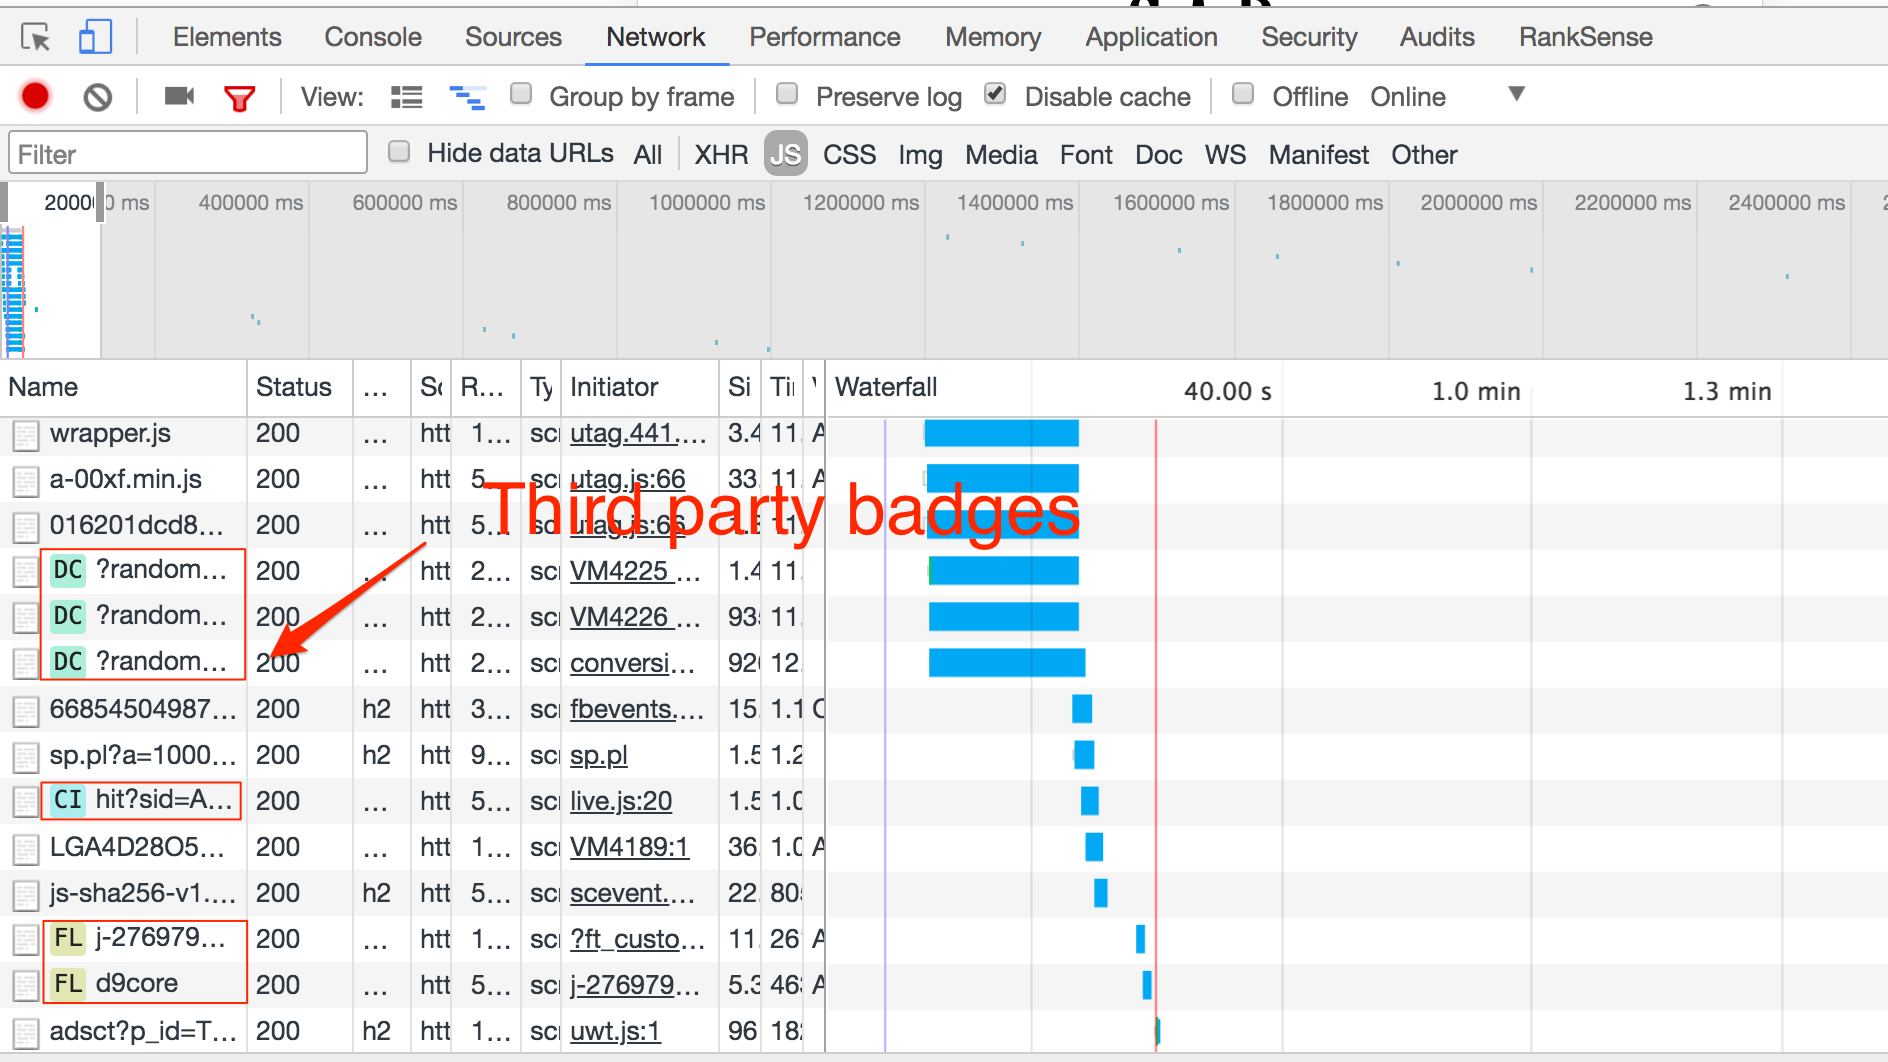
Chrome will add colored badges next to each resource from a third-party site. Mouse over to learn the vendor.
—
Step 2. Gradually block all third-party badges, starting with the slowest ones.
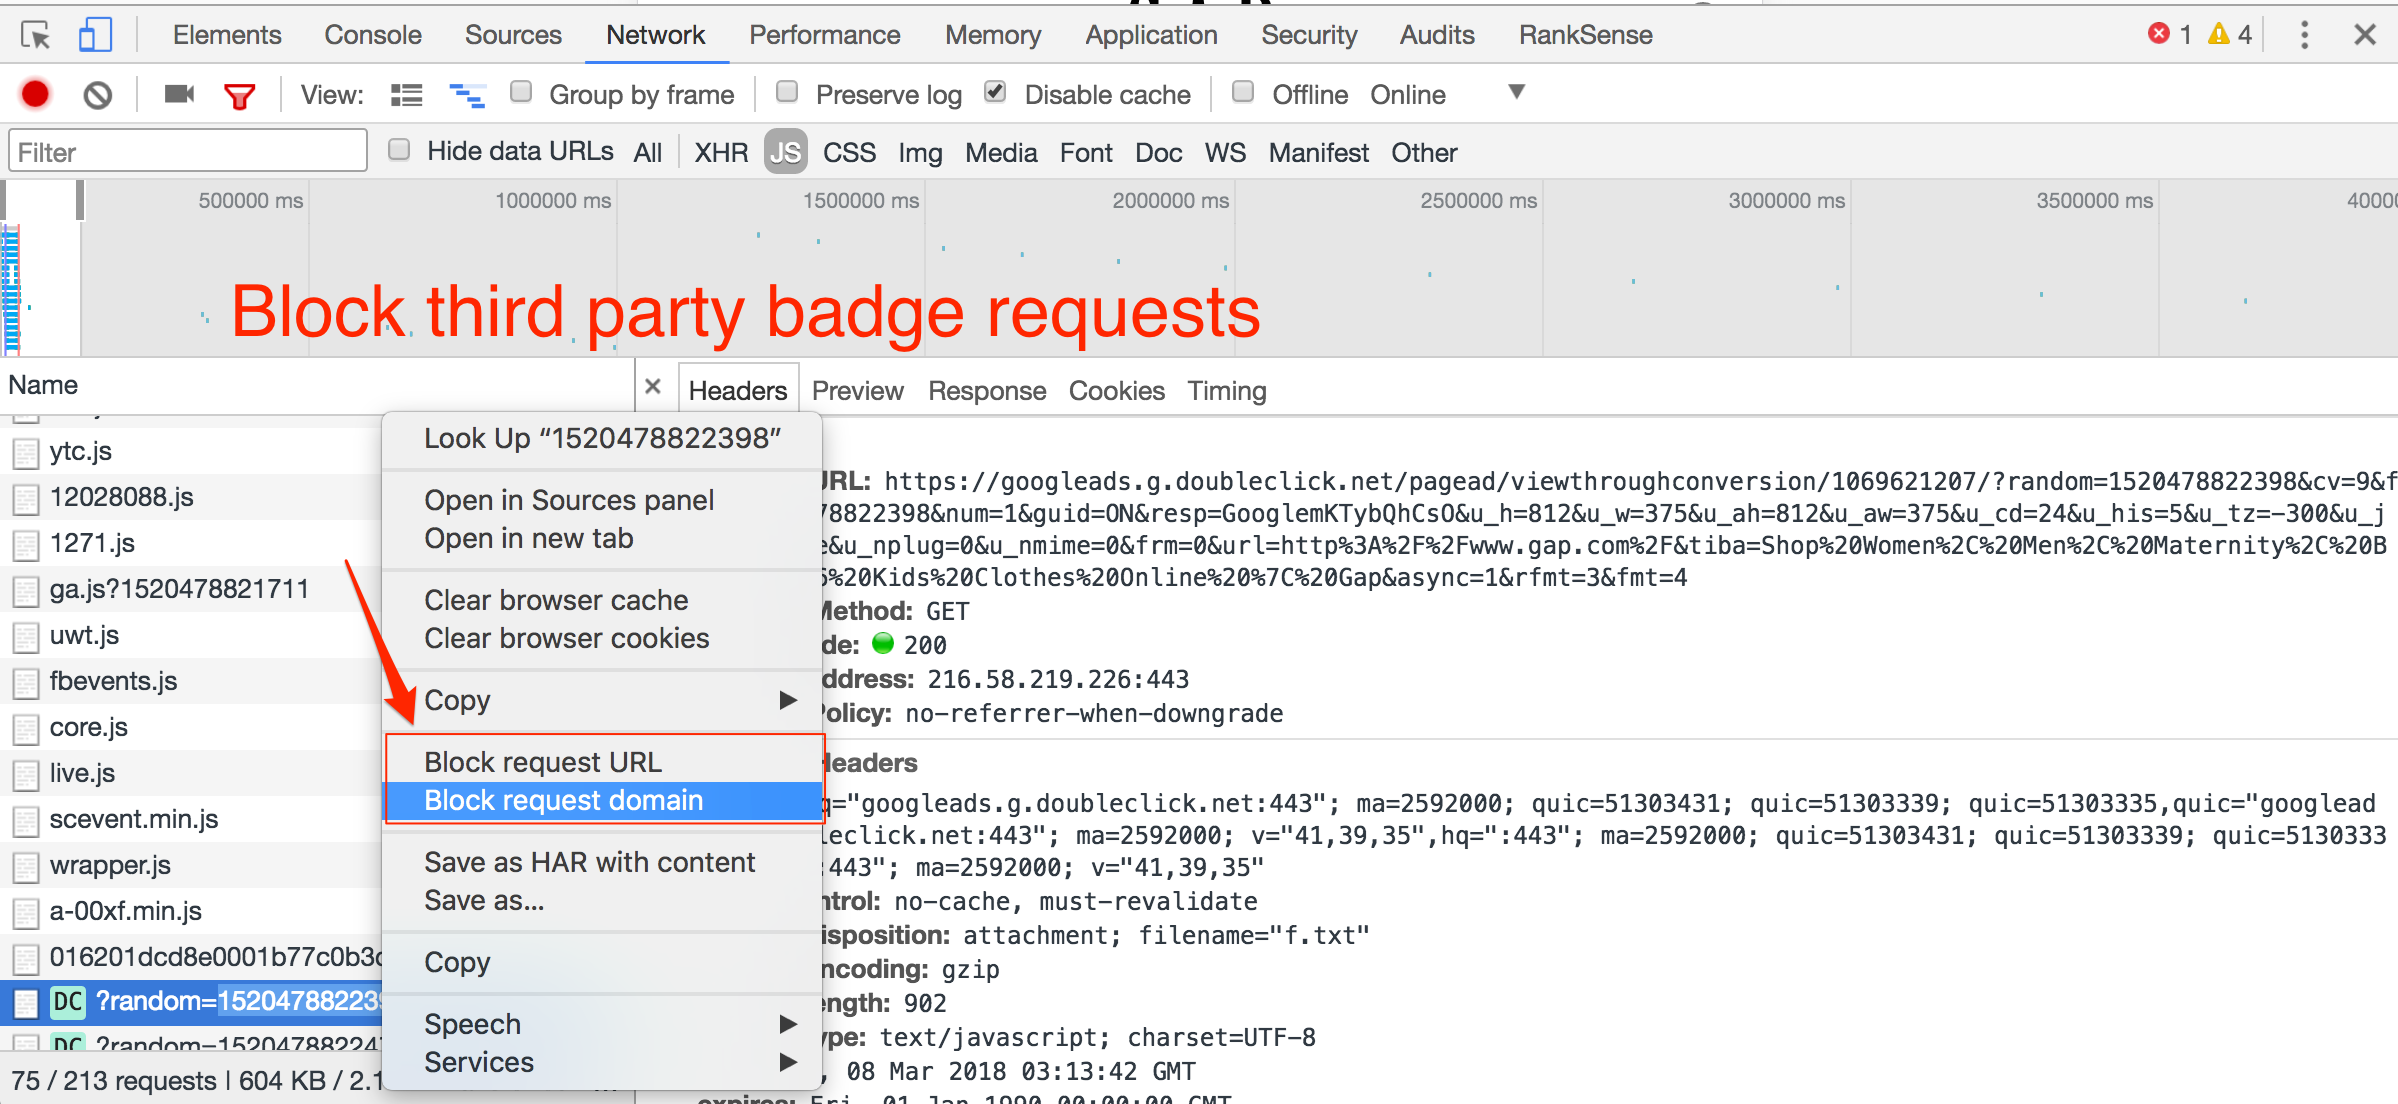
Right-click on third-party resource, and select “Block request URL” to remove.
As you block each resource, hit refresh to see how much the page load time improves.
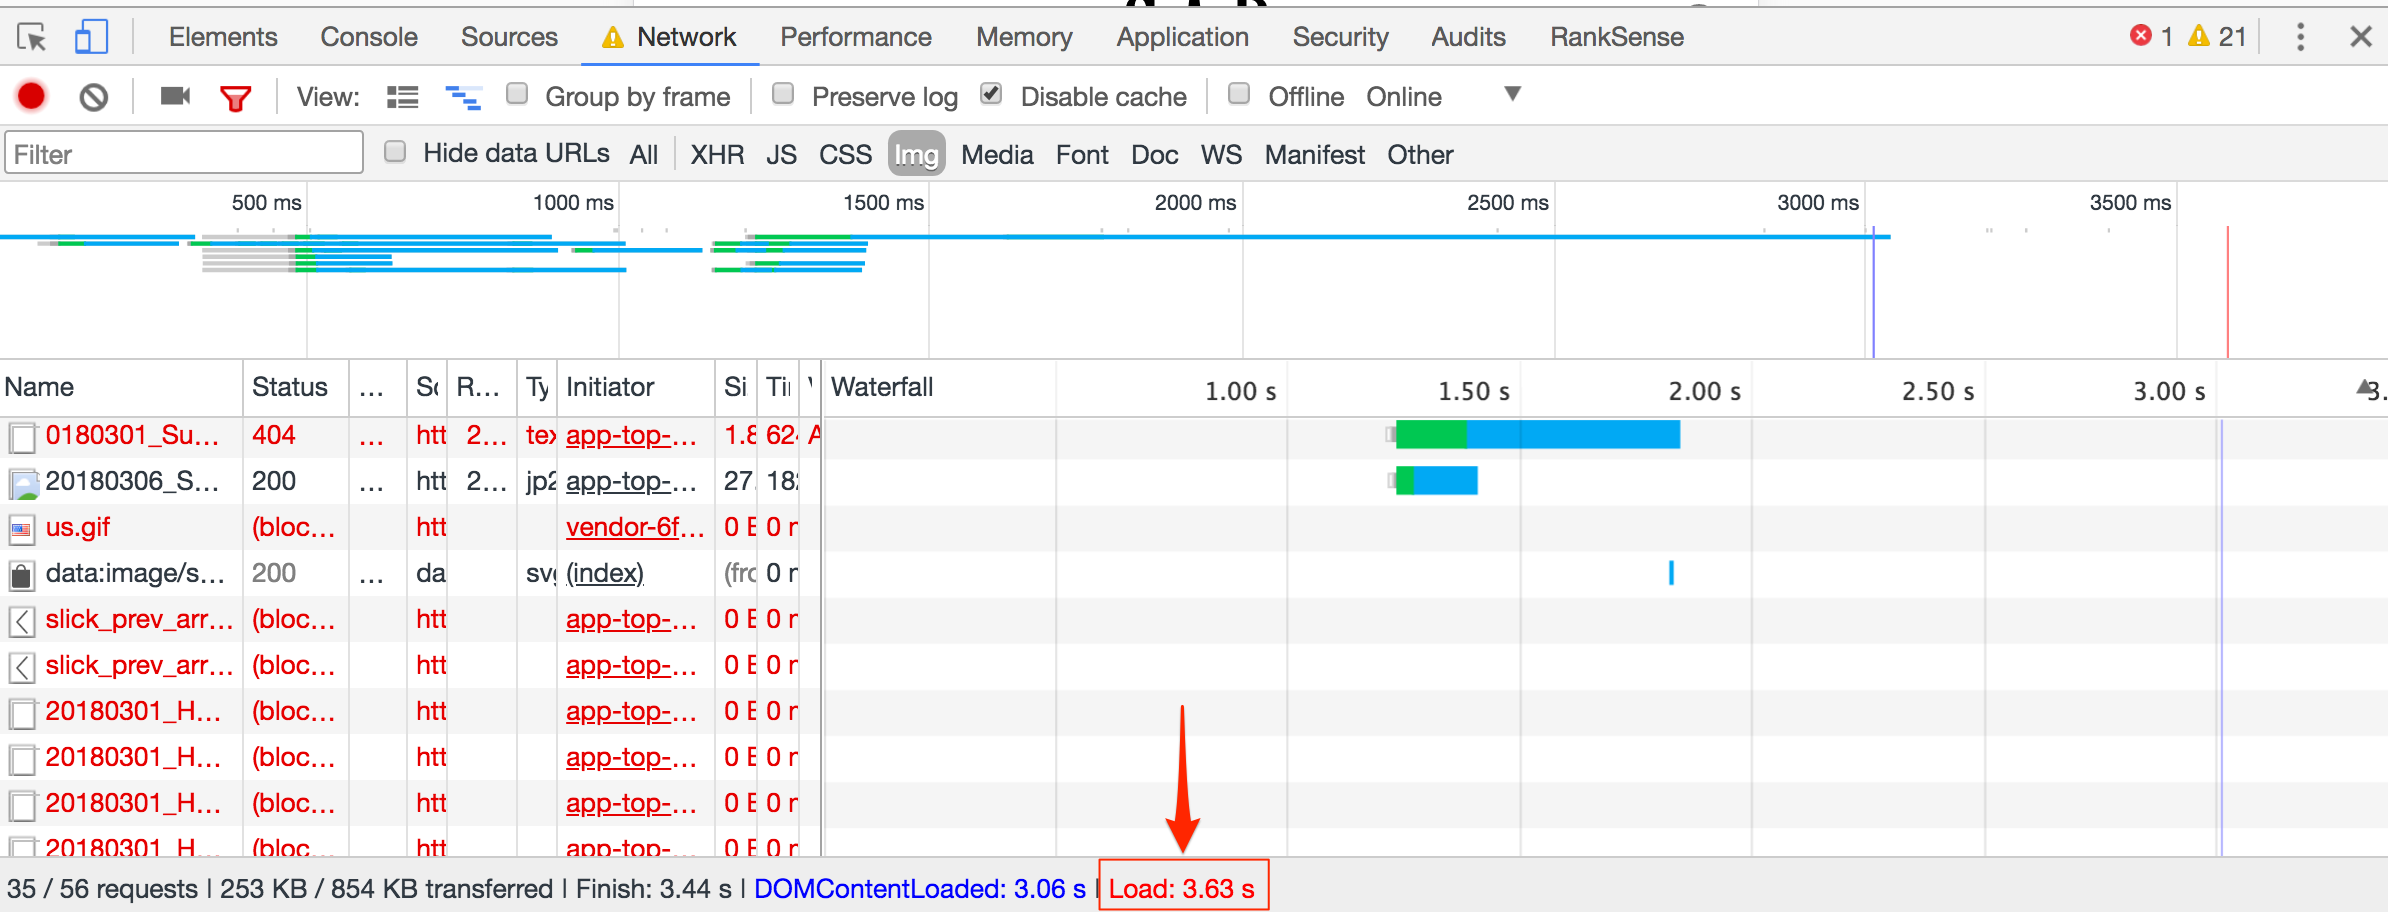
I blocked all of Gap.com’s third-party scripts. That eliminated a whopping 25 seconds of page load time, to 4.35 seconds.
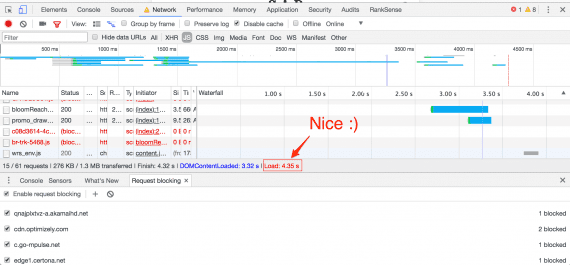
Gap.com would save around 25 seconds of painful page load time, to 4.35 seconds, by blocking third-party scripts.
—
Let’s see if we can push Gap.com to the 3-second mark. First, let’s block two scripts that take 3.5 seconds to load.

On Gap.com, two scripts that push the page load time to 3.5 seconds.
—
There is also a small image that takes over a second to load. Let’s block it, too.
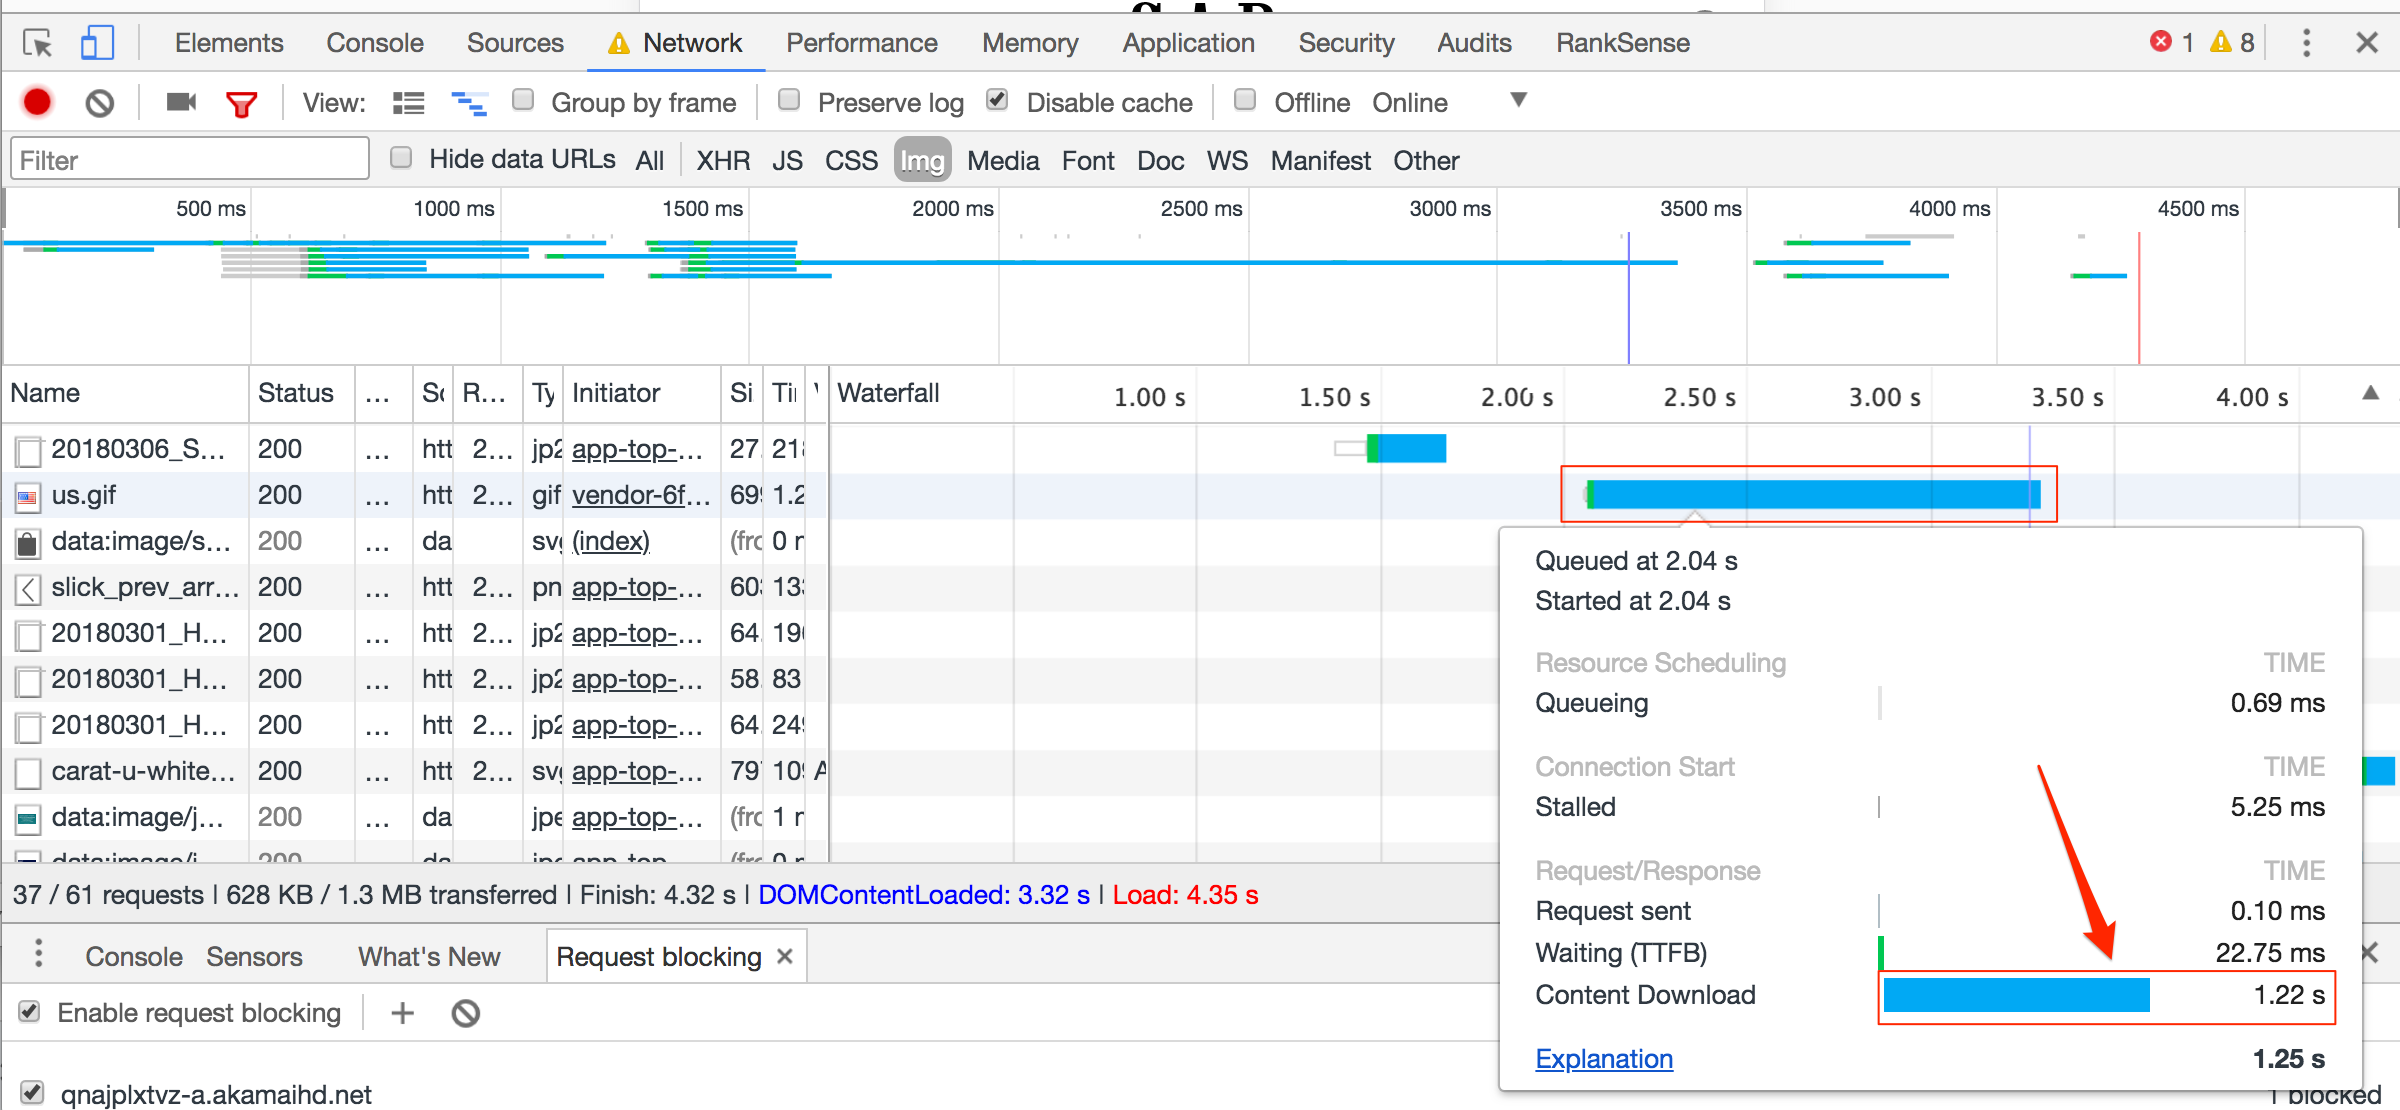
A small image on Gap.com takes more than one second to load.
—
Blocking that small image from loading on mobile improved load times by 1 second.
Blocking a small image from loading on mobile improves load times by almost 10 times.
Gap.com could achieve additional speed improvements if it moved the site to full HTTPS and used the HTTP/2 protocol.
I am not suggesting that Gap remove all third-party scripts and, also, certain images. This exercise merely highlights the main scripts and images responsible for the site’s slowness. It prioritizes development work.
Lazy Loading Scripts
Now that we have the list of scripts and images that are slowing down the site, we can try to load them in a way that would minimize the impact.
Web browsers stop parsing page content when they encounter scripts to execute. This prevents the page from loading faster.
A sample script.
—
To speed up a page, (a) execute the script fetching in parallel to parsing, and (b) delay the script execution after the page fully loads. Use the JavaScript tag attributes async and defer to control the timing and execution of slow scripts.
If we tag a piece of JavaScript using async, the browser fetches the resource in parallel as it parses the document. The script is executed as soon as it becomes available, slowing down the page.
Sample JavaScript using async tag.
—
If we tag a piece of JavaScript with defer, the browser fetches the resource in parallel as it parses the document, and waits for the document to be fully loaded to execute it.
Sample JavaScript using defer tag.
—
Both options can reduce the page load time. The choice depends on the requirements and placement of the script. This simple table will help. See, also, a helpful article on BitsofCode.
| Criteria | Situation | Best Option |
|---|---|---|
| Where is the script element located? | HTML HEAD | async, defer |
| END OF HTML BODY | ||
| Is the script self-contained? | YES | async |
| NO | ||
| Does the script rely on a fully parsed DOM? | YES | defer |
| NO | ||
| Is the script a (small) dependency? | YES | Inline JavaScript |
| NO |
Chrome Developer Tools makes it easy to identify where slow scripts are getting called, and what dependencies they have. We can use this to find where and how the scripts are called.
First, temporarily disable blocked requests to see the slow scripts again. Click on the tick at the bottom of the panel to turn request blocking off.
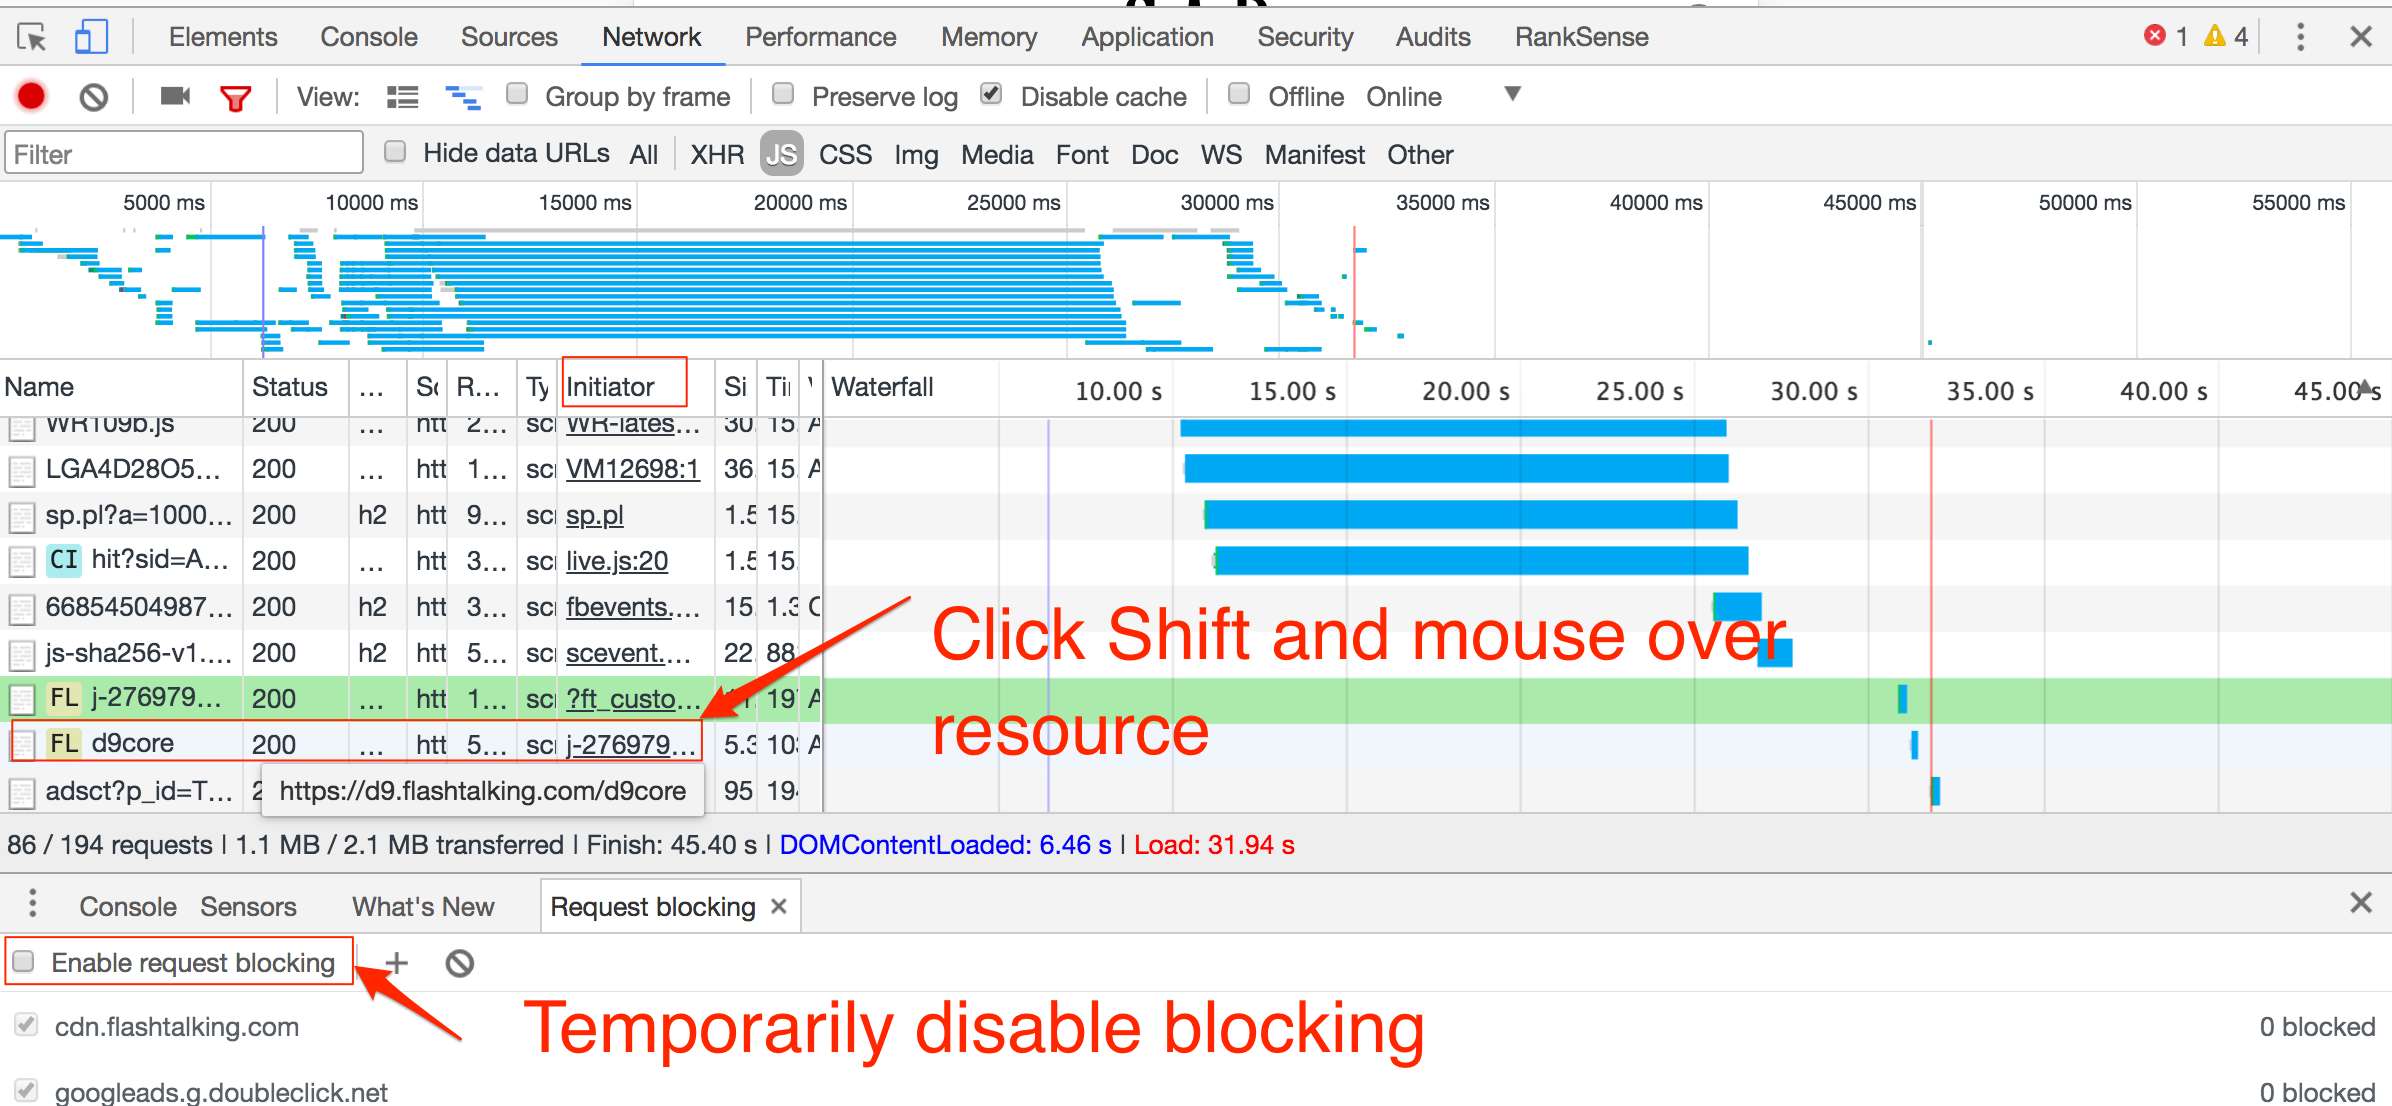
Click on the tick at the bottom of the panel to turn request blocking off.
Second, track the script and line of code. To do this, hold SHIFT on your keyboard and mouse over the element whose caller you want to track. The caller will be highlighted in green. If you mouse over a caller, its callee would be highlighted in red. Click on the script-page name under the Initiator column to get the exact source line of code.

Hold SHIFT on your keyboard and mouse over the element whose caller you want to track. The caller will be highlighted in green. If you mouse over a caller, its callee would be highlighted in red. Click on the script-page name under the Initiator column, and you will get the exact source line of code.
Third, update source line to add async or defer as applicable.
The script is getting called from a “document.write” directive, which is discouraged by web performance experts as it results in additional unnecessary slowdowns.
Thus, Gap.com should require their vendors to rewrite or modify the scripts to fix the issues.
Next, after we change the loading behavior of most slow scripts, we can focus on the slow images.
Recommended

Remembering Hamlet Batista
February 8, 2021
Lazy Loading Images
Similar to the scripts, we can delay loading images until they are in the user view. There are no standard tags you can use to label images, but there are powerful open source scripts you can use for this purpose.
A typical lazy loaded image looks like this:
<img alt=”…” data-src=”image1.jpg” width=”220″ height=”280″>
Instead of the standard image attribute src, we have the non-standard data-src, which will be ignored by the browser. A piece of JavaScript on the page could detect when a user is going to need an image and will load it dynamically.
Lazy loaded images were traditionally ignored by search engine bots, which prevented the images from getting indexed. But, that is no longer a problem, as Googlebot and Bing are now executing JavaScript. You still need to check what technique the script uses to display the images. If it relies on the page-scrolling event, it won’t be SEO friendly because search engine bots don’t generate scroll events when executing JavaScript.