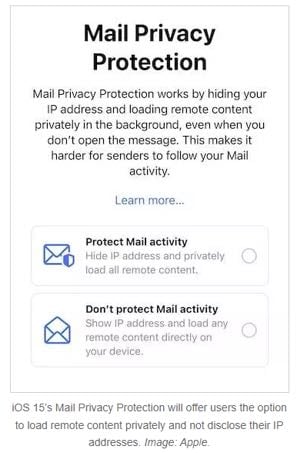
On Sept 20, 2021, Apple released iOS 15. Among its new features is “Mail Privacy Protection,” which does two things:
- Automatically loads all images from emails,
- Hides IP addresses and the location of email recipients.
For years, email service providers have embedded a hidden, 1×1-pixel image to track opens. That image was automatically downloaded by recipients when they opened an email, which providers then logged.
Now, however, all recipients on iOS 15 devices — iPhones, iPads, Apple Watches — register as an open, regardless of whether they took that action.
The result is inflated open rates.

Impact to Date
Apple iPhones are roughly 48% of the U.S. smartphone market. And in 2022 most email opens are on a phone — upwards to 75%. Thus approximately 36% of all U.S. email recipients (48% x 75%) could be using iOS 15.
The unknown is how many iOS 15 users have enabled Mail Privacy Protection. However, Apple’s description — “Protect Mail activity. Hide IP address and privately load all remote content” — likely entices most users to opt-in.
Consider the following scenario.
Email recipients, U.S.:
- iOS 15: 36%
- All others: 64%
Actual historical commercial open rate, average:
- 20%
Open rates due to iOS 15, U.S.:
- iOS users: 100%
- All others: 20%
- Total, blended: (36% x 100%) + (64% x 20%) = 48.8%
In short, an average commercial email list could report open rates of 48.8% due to iOS 15 instead of likely actual open rates of roughly 20%.
That calculation, however, assumes (i) all users of Apple mobile devices have upgraded to iOS 15, (ii) all have opted into Mail Privacy Protection, and (iii) all live in the U.S., where the iPhone has a 48% market share. Worldwide, the iPhone’s market share is roughly 15%.
Actual Open Rate Increases
The above example represents the maximum impact. But my clients — large corporations, mainly — have seen open rates as roughly doubling, not to 48.8%.
Click rates for those clients have remained constant. However, click-to-open rates have decreased due to the artificially high percentage of opens.
Here are the averages I’ve seen among, again, large corporations.
Open Rates:
- Before iOS 15: 6% – 12%
- After: 18% – 25%
Click Rates:
- Before and after: 1% – 4% (no change)
Click-to-open Rates:
- Before: 7% – 15%
- After: 1% – 5%
Strategy Implications
Testing email based on open rates is compromised. That includes subject lines, time of day, and day of week. However, an A/B test on, say, subject lines should still correctly identify the winner assuming the ratio of iOS 15 recipients is consistent for both groups. My clients continue to rely on A/B tests for that reason.
What would not be accurate is a test that compares subject lines from before and after iOS 15. An example is 2020 holiday emails versus 2021.
Customer journeys that rely on email opens are also compromised. For example, a journey flow is likely inaccurate if it sends a unique nurturing message to recipients who opened but did not click. All iOS 15 users would receive that message regardless of their actions.
A workaround for many senders is to use clicks to dictate the journey path. Some separate iOS 15 recipients from all others and create separate journey paths for each group. That separation is likely the best option if your email service provider can identify recipients’ devices.
Industry Reaction
Consumers generally support Mail Privacy Protection. However, email marketing professionals understand the unintended consequences. Before iOS 15, a consumer who never opened a commercial email would eventually stop receiving it. Not so afterward.
Moreover, open rates help marketers understand recipients’ preferences to adjust content and frequency accordingly. That, too, has gone away.


