Editor’s Note: This article was originally published by Web Marketing Today. Practical Ecommerce acquired Web Marketing Today in 2012. In 2016, we merged the two sites, leaving Practical Ecommerce as the successor.
Dashboards provide an efficient way to review your Google Analytics data. By combining relevant data into a dashboard, you can quickly and easily make determinations about your website’s performance.
There are so many options for dashboards that you may want to create several, tailored to different aspects of your site traffic. You can build specific dashboards for employees by focus area or construct a more high-level dashboard for executives.
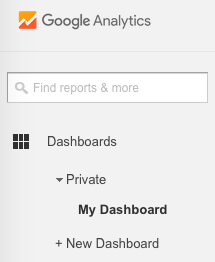
Think dashboards are important? Google does; it lists them first.
For example, you can set up separate dashboards for SEO content analysis, paid advertising, social media, email, referral traffic, and more, which your marketing team can access. You could also create dashboards for your IT team that measure site performance, browser data, desktop, and mobile visitor information.
Your executives may need a “new Google Analytics user” dashboard, one with a 50,000-foot view of the site metrics, or one that is ecommerce-related, if you transact business online.
Widgets
Google Analytics includes data and reports in a dashboard by adding them as widgets. You can add widgets from within the dashboard or by clicking the “Add to Dashboard” button at the top of most Google Analytics reports.
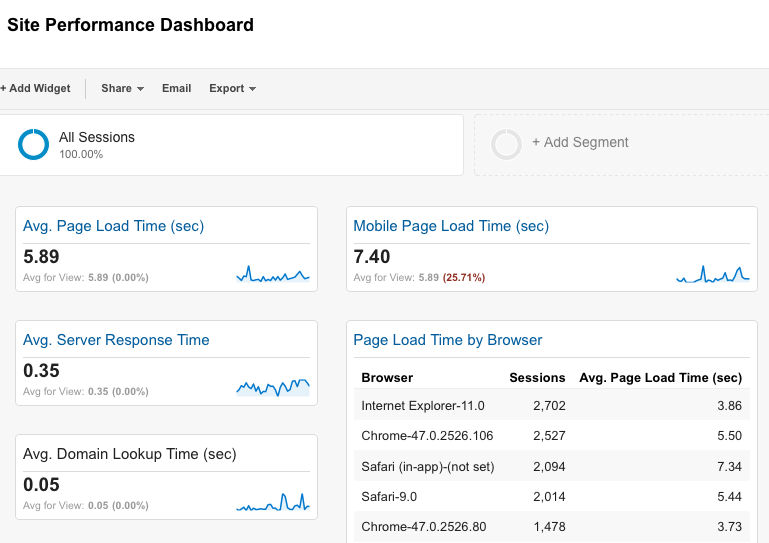
Add multiple widgets to a dashboard, to view the correlation between metrics.
Although you can build a dashboard using only one widget, having multiple widgets allows you to see the relationship between different metrics.
There are six types of widgets that you can add to a dashboard:
- Metric. Displays a single value for the selected Google Analytics data;
- Used to show an exact value
- Timeline. Displays a graph of a Metric over time. You can show up to two Metrics on a Timeline;
- Used to see trends over time
- Geomap. Displays a map of a continent, subcontinent, or the world, with the specified Metric plotted on the map;
- Used to find locations
- Hover to see exact values
- Table. Displays either one or two Metrics, describing the selected item shown in a table, with 5-10 rows of results;
- Used to compare multiple values
- Pie. Displays a pie chart of segments in the selected Metric;
- Used to compare percentages
- Hover to see exact values
- Cannot be used with real-time data
- Bar. Displays segments of the selected Metric in vertical or horizontal bars. Up to two Metrics can be shown in the bar chart.
- Used to see proportions
- Hover to see exact values
- Cannot be used with real-time data
‘My Dashboard’
When you create a view in your Google Analytics account, a standard dashboard — called “My Dashboard” — gets included in the Reporting section.
My Dashboard contains widgets showing the following metrics and dimensions for your website:
- Separate timelines for number of users, new users, bounce rate, goal completions, and revenue;
- Geomap indicating the frequency of sessions;
- Table of sessions by browser;
- Timeline showing both average session duration and pages/session.
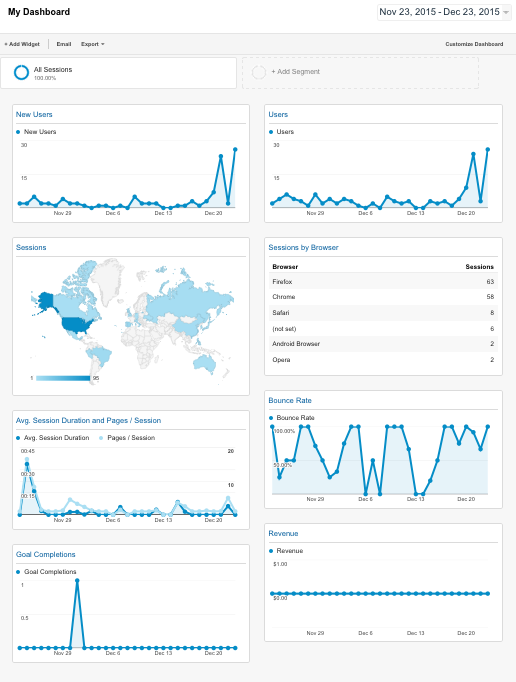
The default dashboard shows data that may not be relevant to all websites.
While My Dashboard may fit the needs of many websites, if it doesn’t match your business goals, you can customize it or create a new one.
You can modify My Dashboard by adding, removing, or rearranging the widgets, or by filtering the data displayed. Here are some other ways to modify dashboards:
- Change the name of the dashboard’s title;
- Adjust the date range or compare two date ranges;
- Share or remove the dashboard;
- Add or remove segments.
If you added a widget from a Google Analytics report instead of from within the dashboard, you can open the corresponding report by clicking on the widget’s title.
Google Analytics Solution Gallery Options
You can also select and import premade dashboards from the Google Analytics Solution Gallery. (Find out more about the Google Analytics Solutions Gallery in this article on defining Google Analytics website goals.) In addition to goals and reports, the Solutions Gallery contains dashboards shared by other users.
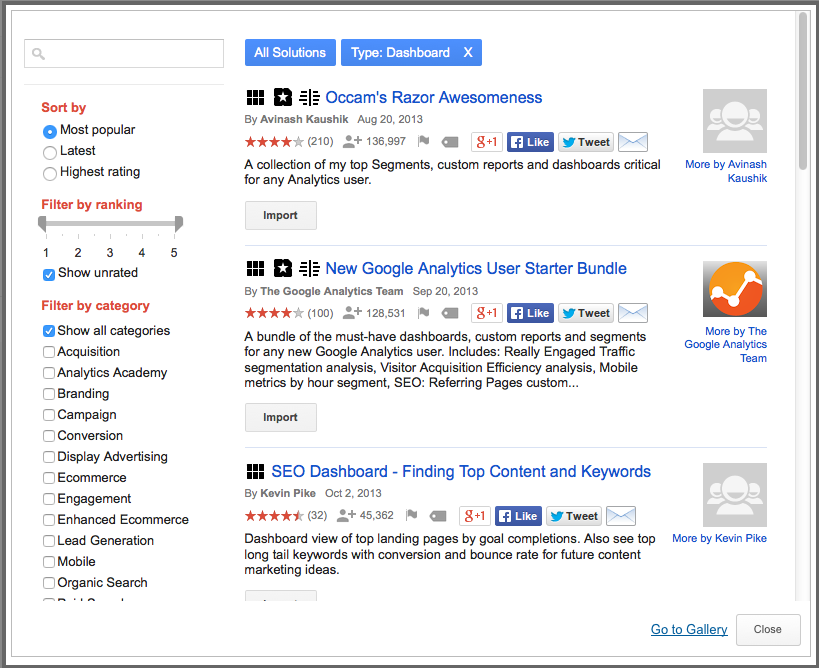
Find pre-made dashboards in the Google Analytics Solutions Gallery.
I recommend that you filter the dashboards to view those with the highest ratings. Also, select dashboards published by the Google Analytics Team or Google Analytics evangelists such as Avinash Kaushik and Justin Cutroni.
Once you’ve identified a dashboard to import, you may also want to check the last date it was updated as the information may be irrelevant or out of date.
Sample Dashboard Metrics
If you decide to start from scratch, you can create your own dashboards using a blank dashboard template.
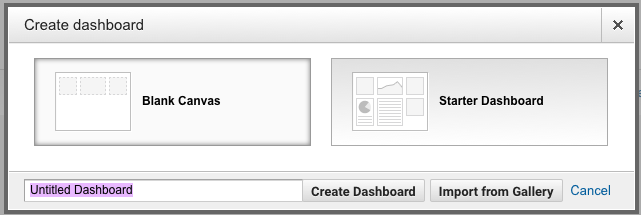
Creating new dashboards can be as easy or as complicated as you want it to be.
Below are five prospective dashboards and what you should include in them.
(Note: I suggest keeping the number of widgets to a maximum of 10-15 so that the dashboard doesn’t seem so overwhelming. Separating the information into individual dashboards will allow you to focus on what’s significant on that specific dashboard. These are general recommendations that are relevant for many websites, although your requirements may differ.)
General Analytics Dashboard:
- Unique visitors (over time);
- Unique visitors by channel
- Traffic acquisition channels: paid, organic, referral, direct;
- Top keywords;
- Top viewed pages;
- Websites sending referral traffic (for backlink opportunities; filter out search engines or social media sites);
- Social networks sending the most traffic;
- (Optional: top countries and language preferences).
IT/Technical Dashboard:
- Unique visitors (over time);
- Unique visitors by location
- Bounce rate (over time);
- Bounce rate by browser
- Pages with the highest bounce rate
- Average page load time;
- Slowest loading pages;
- Cities with slow load times;
- Sessions and bounce rate by screen resolution;
- Sessions and bounce rate by device
- Operating systems used;
- Top mobile devices;
- Average time on site (over time);
- Days between visits.
Entrances/Exits:
- Total unique page views (over time);
- Pages with highest entrance rate;
- Pages with highest exit rate;
- Average pages viewed per visit;
- Pages with the highest bounce rate.
Engagement/Loyalty:
- Visits by device (desktop/mobile/tablet);
- Pages/Session and average session duration by device;
- Day of the week by device;
- Users and pages/session for more than 1x/week visitors;
- Sessions and pages/session by source/medium.
SEO (filter traffic to SEO-only):
- Unique visitors (over time);
- Top keywords (non-branded);
- Location keywords (for local SEO include your city);
- Visits by city/state/country;
- Keywords related to your product or service;
- Top search engines used for organic traffic;
- Top viewed pages.
Here are some additional dashboard themes that you can use, depending on whether you actively participate in each area:
- Paid Media (PPC – AdWords, Bing, Yahoo);
- Social Media;
- Email;
- Blog Traffic;
- Ecommerce;
- Mobile.
Dashboards provide an overview to see what’s right and what’s wrong with your website. Setting them up with relevant data will make website reporting easier since you’ll have all of the information that you need together in a single interface.
Don’t see a dashboard that’s right for you? Have a question about which dashboard items to include or if a Solution Gallery selection might be applicable? Leave a comment below with your Google Analytics dashboard concerns and we’ll work together to resolve them.


