The proliferation of marketplaces and advertising channels represents a data challenge for ecommerce merchants. Increasingly, merchants are selling on Amazon, eBay, and Walmart, for example, in addition to their own websites. Many are now advertising beyond Google AdWords and Bing ads to other channels, such as Facebook and AdRoll.
The challenge is obtaining traffic and conversion data from each of those sources. Setting up key reports in Google Analytics can be time-consuming. Google Data Studio solves these challenges by providing a free dashboard that supports importing many data sources.
Google Data Studio
Data Studio improves the dashboard experience beyond dashboards reporting in Google Analytics, to include all data sources, not just Google-owned properties. I introduced Google Data Studio in a previous article, soon after it launched to the public.
Once you have access to Data Studio, try one of the many templates.
Choose the template you prefer and click on “File > Make a copy…” to save it. I chose the “ACME” report for this example.
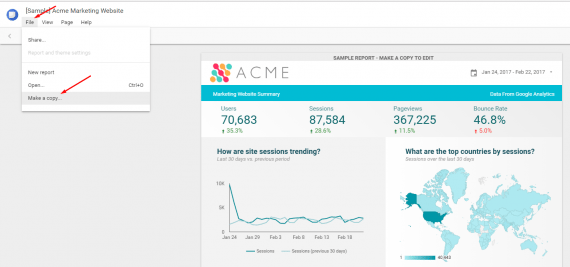
Choose a template you like and click on “File > Make a copy… .”
Google Analytics Data
Importing your Google Analytics data is a good first step to creating a report. Do this by clicking on “Create New Data Source” on the right-hand side.
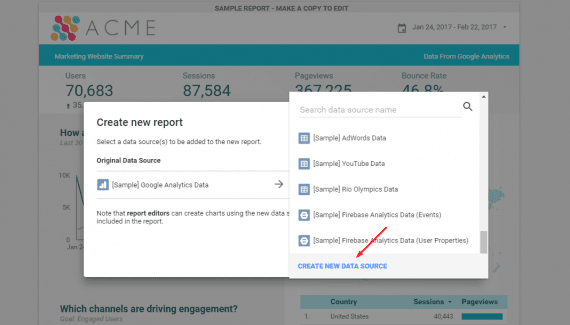
Click on “Create New Data Source” on the right-hand side.
Select “Google Analytics” on the data source selector page, then find your Google Analytics Account, Property, and View and select “Connect.”
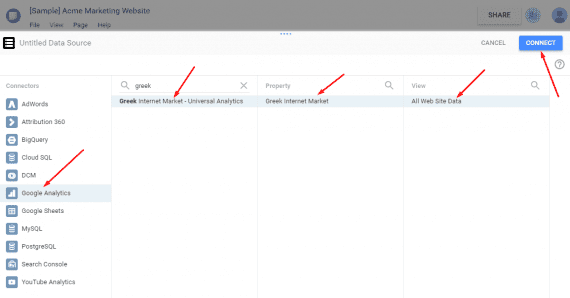
Find your Google Analytics Account, Property, and View and select “Connect.”
—
On the next page, select the Dimensions and Metrics you want to include. These will be available in the report. Click the “Add to Report” button.
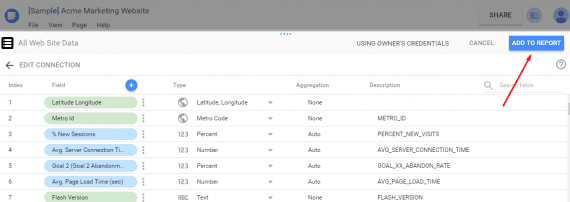
Click the “Add to Report” button.
—
On the next page click the “Create Report” button.
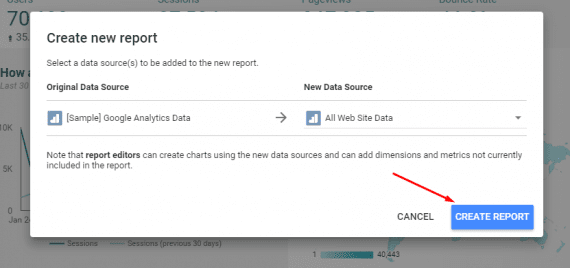
Click the “Create Report” button.
The Data Studio report will populate with your Google Analytics data. You are off and running.
Additional Data Sources
Most Google products, such as AdWords, YouTube, and Google Sheets, are available as native data sources. Add additional data sources, such as Amazon and eBay sales, with a “Community Connector.” MailChimp, Constant Contact and other email platforms are available in the Connector Gallery, as are advertising platforms, such as Facebook Ads, AdRoll, Bing Ads, and more. Social media reporting, such as from Facebook, Twitter, and Pinterest, is also available.
The data sources are growing. So periodically check back for updates.
Assembling the Dashboard
Using all your data sources, build a comprehensive dashboard for quick insights into current performance and comparison to prior periods. Consider these tips.
- Have the first page of the dashboard include summary data, such as total sales across all platforms, total advertising spend, total website traffic, and other high-level metrics.
- Include date comparisons to the prior year in scorecards and tables to monitor performance year-over-year
- Use additional pages for details by data source — website sales, Amazon sales, eBay sales, as well as advertising channels, such as AdWords, Bing Ads, Facebook ads.
- Include email, affiliate marketing, and social media performance in supporting pages.
Review your comprehensive Data Studio dashboard regularly. Use the data to generate ideas for growing your business.