How quickly a business sells its inventory is typically a strong indicator of efficiency, cash flow, and general well-being.
Imagine two online retailers selling products for home gardeners. Both companies hold about $1 million in inventory on average. But one company turns its inventory 10 times each year and the other only five times. The company with 10 inventory turns should experience better cash flow and more sales.
Thus, inventory turnover — and the related inventory turnover ratio — is a powerful key performance indicator.
Inventory Turnover Ratio
There are at least a couple of ways to calculate an inventory turnover ratio: (i) total sales divided by ending inventory or (ii) cost of goods sold divided by average inventory.
The calculations produce different results. The method you choose depends on which provides a better view of your company’s inventory and sales performance.
Sales and ending inventory. Many investors use a company’s sales and its ending inventory to calculate its inventory turnover ratio.
Sales ÷ Ending Inventory
For example, for the fiscal year ended January 31, 2020, The Home Depot reported total revenue of $110.2 billion, a cost of revenue (roughly the cost of goods sold) of $72.7 billion, and an inventory balance of $14.5 billion (which I will use as a stand-in for both ending inventory and average inventory), according to Yahoo! Finance.
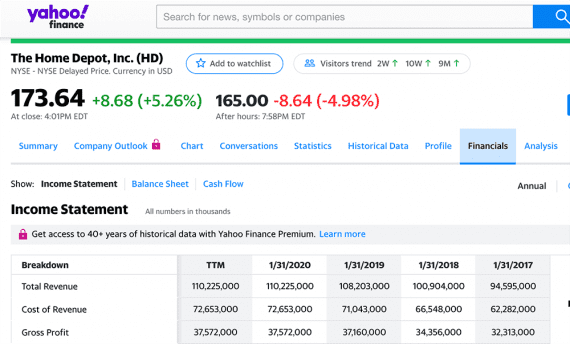
We can calculate inventory turnover for a single public company (such as The Home Depot) and estimate the average turnover for an entire industry.
Using this method we could calculate Home Depot’s inventory turnover ratio as 7.6. Home Depot turns over its inventory about 7.6 times each year.
$110.2 billion ÷ $14.5 billion = 7.6
If we wanted to know home many days it takes The Home Depot to turn its inventory once, we could divide the number of days in the year by the inventory turnover ratio we just calculated.
365 ÷ 7.6 = 48 days
Using this method, we would estimate that The Home Depot turns its inventory about once every 48 days. This method is generally a little optimistic since it includes the company’s profit when it takes total sales as its numerator.
COGS and average inventory. A second method is to divide the cost of goods sold by the average inventory for the time frame in view. This typically provides a more accurate view of inventory turnover because it excludes any markup.
COGS ÷ Average Inventory
Let’s continue with The Home Depot example, using $14.5 billion in average inventory and approximately $72.7 billion for the cost of goods sold.
$72.7 billion ÷ $14.5 billion = 5
Notice this method produces a different inventory turnover ratio. In this case, we would estimate that The Home Depot turns its inventory about once every 73 days.
365 ÷ 5 = 73 days
This calculation, which is called “Days’ Sales of Inventory” or “Days’ Inventory,” can estimate how long it takes to get a return on investment for inventory purchases.
Interpreting Inventory Turnover
Knowing your company’s inventory turnover ratio won’t necessarily help you understand how the business is performing. For that, you need context.
First, estimate the average inventory turnover ratio for your industry. If you sell building supplies, tools, and items for do-it-yourself projects, calculating inventory turnover for companies such as Home Depot and Lowe’s could provide context.
Also, you could find industry inventory turnover estimates online. A quick Google search, for example, shows that grocery stores typically have an inventory turnover of 40.
Next, benchmark your company’s inventory turnover. Review your financial data and calculate an inventory turnover ratio for each month, quarter, and year for at least the past couple of years. Armed with an industry average and your company’s benchmark, you could better gauge your inventory performance.
High inventory turnover. For example, a relatively high inventory turnover compared to the industry or your past performance is a good indicator of healthy sales and efficient purchasing. Your company is apparently making good inventory investments without overstocking.
But a high inventory turnover could also indicate too few purchases. Are you, for example, running out of stock?
Low inventory turnover. Conversely, if your company’s inventory turnover is low when compared to your industry or your own past performance, you likely have a sales or purchasing problem.
Low sales could mean that demand for your products is waning or that new competitors have entered the market.
A relatively low inventory turnover could also mean that you had dead inventory or that your business has been placing too many orders.
In short, monitoring inventory turnover can help ensure that things are going well with your business. As an added step, evaluate inventory turnover and inventory sell-through rates together.