Direct-to-consumer companies, including Amazon sellers with private label products, can use the price elasticity of demand to determine the optimal price for a given product and, thereby, potentially increase revenue, profit, or both.
When you know how price affects demand, you can predict how many units your business would sell at a specific price along a demand curve. This information, in turn, can help you set a product price that will generate the most profit.
An example may help.
Imagine you have calculated the price elasticity of demand for your company’s top-selling product. Using this information, you’ve projected unit sales for that product at price points ranging from $10.99 to $14.99.
| PRICE | PROJECTED UNITS SOLD | REVENUE | COST OF GOODS SOLD | PROFIT |
|---|---|---|---|---|
| $10.99 | 1000 | $10,990.00 | $5,000.00 | $5,990.00 |
| $11.99 | 990 | $11,870.10 | $4,950.00 | $6,920.10 |
| $12.99 | 974 | $12,652.26 | $4,870.00 | $7,782.26 |
| $13.99 | 821 | $11,485.79 | $4,105.00 | $7,380.79 |
| $14.99 | 645 | $9,668.55 | $3,225.00 | $6,443.55 |
Notice that at $10.99, your company could expect to sell the most products. Those 1,000 units sold would be impressive, but your data shows that a $10.99 price would generate $5,990 in profit, which is the least profitable option.
If, however, you sell the product at $12.99, your unit sales would decrease to 974, but the profit would rise to $7,782.26. Thus, it makes sense to price this product at $12.99.
Now let’s see how you can create this sort of projection for your direct-to-consumer business.
Price Elasticity
There are a few ways to calculate the price elasticity of demand. In each case, the aim is to measure how much demand stretches, if you will, as the price changes. For our purposes, we will calculate it in two ways.
The simple way is to divide the percentage change in quantity sold by the percentage change in price.
Price Elasticity of Demand = (% Change in Quantity Sold) / (% Change in Price)
In a Google Sheet or an Excel spreadsheet, you can easily build this formula, where column A contains the price, and column B is the units sold at that price.
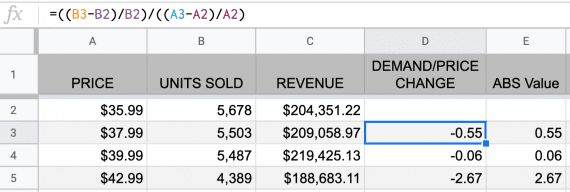
The percent change of units in column B is divided by the percent change in price in column A.
Assuming a header in row 1 and the data for price and demand are in rows 2 and 3, the simple price elasticity of demand formula would be:
=((B3-B2)/B2)/((A3-A2)/A2)
Think about this formula in two parts.
First, we need to determine the percent change in demand (units sold). That’s the numerator (top) portion of the equation. Next, we compute the percentage change in price, which is the denominator (lower) portion.
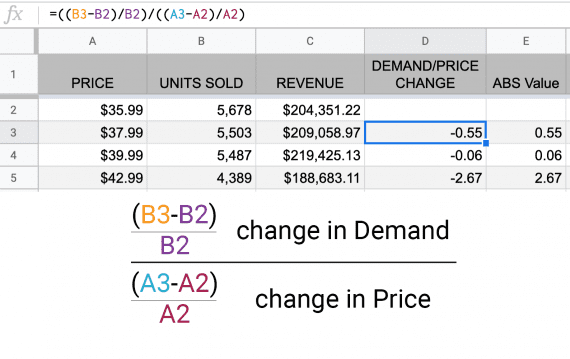
The numerator (top) portion of the equation is the percent change in units sold. The percent change in price is the denominator (lower) portion.
In our example, our price elasticity of demand is:
[(5503-5678)/5678)] / [(37.99/35.99)/35.99] = -.5546
In general, if the absolute value of the price elasticity of demand is less than 1, it is said to be inelastic or not very stretchy. If the absolute value of the price elasticity of demand is greater than 1, it is elastic.
In other words, the closer this value gets to 0, the less your customers are worried about the price.
However, there is a problem with this simple method of calculating price elasticity. If we reverse directions on the demand curve, we can get a much different number. Thus, if our formula were as follows, we’d have a slightly different price elasticity of demand.
=((B2-B3)/B3)/((A2-A3)/A3)
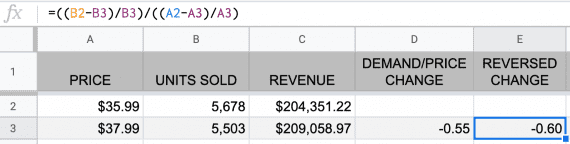
Reversing the direction on the demand curve changes the value.
Midpoint Method
To resolve this problem, we can calculate the price elasticity of demand using the midpoint method.
This midpoint method uses the average change in units sold and the average change in price. Here is an example for a Google Sheet or an Excel spreadsheet.
=((B3-B2)/AVERAGE(B2,B3)/((A3-A2)/AVERAGE(A2,A3)))
Now compare it to the simple equation.
=((B3-B2)/B2)/((A3-A2)/A2)
Notice that (B3-B2)/B2 has been replaced with (B3-B2)/AVERAGE(B2,B3).
This small change will produce a price elasticity of demand value that will be the same even if we reverse the order of the calculation.
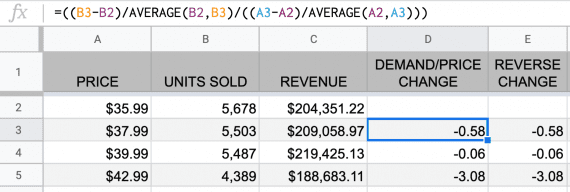
Using the midpoint method, we get the same price elasticity of demand regardless of which way we move on the demand curve.
Projecting Profit
Knowing how to calculate the price elasticity of demand based on actual sales data, we can forecast how many units of a product you would likely sell at a new price point. This can be important if you’re trying to maximize revenue or profit.
Imagine that your product had sales data like this.
| PRICE | UNITS SOLD | REVENUE | DEMAND/PRICE CHANGE | COGS | PROFIT |
|---|---|---|---|---|---|
| $5.00 | 90 | $450.00 | $225.00 | $225.00 | |
| $7.00 | 80 | $560.00 | -0.35 | $200.00 | $360.00 |
| $10.00 | 70 | $700.00 | -0.38 | $175.00 | $525.00 |
| $14.00 | 40 | $560.00 | -1.64 | $100.00 | $460.00 |
The $10 price point is the most profitable ($525), but you wonder if you can squeeze out a few more dollars per unit. So you want to project how much revenue you’d generate if you increased the price to $12.
To do this we first consider the new price in the context of the known price points. The new price, $12, is between $10 and $14, so we are going to take the average of the price elasticity of demand for each price point.
If you are using a spreadsheet, where the elasticity of these are in cells D4 and D5, your formula will look like this.
=AVERAGE(D4:D5)
=AVERAGE(-.038:-1.64)
-1.01
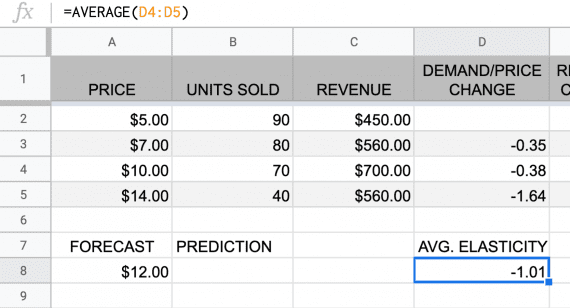
Using a Google Sheet or Excel spreadsheet, employ the AVERAGE function.
Next, we need to predict the number of units sold at this new price point. Start by taking the new price ($12) and subtracting the old, lower price ($10).
12-10
Divide this result by the old, lower price ($10).
(12-10)/10
Multiply this result by the average price elasticity of demand that we calculated earlier.
((12-10)/10)*-1.01
This is multiplied by the units sold at the lower price (70: the number sold at $10).
((12-10)/10)*-1.01*70
Finally, take this result and add the units sold at the lower price.
((((12-10)/10)*-1.01)*70)+70
On a spreadsheet, we would use the cell’s location (i.e., A8) rather than its value. Thus the formula would look something like this.
=((((A8-A4)/A4)*D80)*B4)+B4
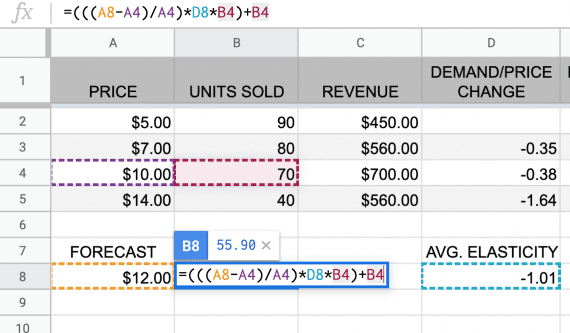
The formula to predict the units sold at a new price point relies on the average price elasticity of demand from the price point below and above it.
In the end, given this product’s demand curve, you should not try to raise the price to $12, as the projected revenue would be $670.81, lower than the $700 of revenue from the $10 price.
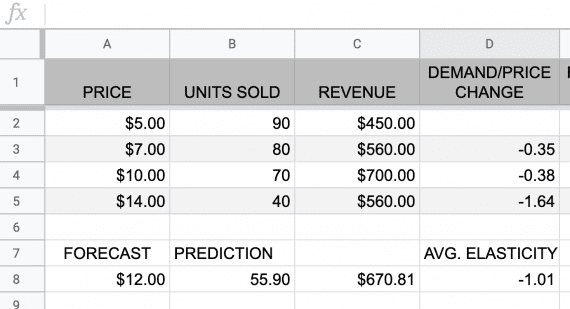
As tempting as it might be to raise the price, it will not result in more revenue in this example.
In this article, I introduced you to price elasticity of demand and showed you one way you can use it to predict how a change in a product’s price will impact the number of units your company sells. Now, go and optimize the prices for your DTC products.