A production scheduling model first proposed in 1913 and popularized in the late 1980s may help modern companies understand how much inventory to buy and how often, saving money in the process.
Ford Whitman Harris, an American production engineer, developed the economic order quantity (EOQ) model to help buyers at manufacturing companies understand how much of a given raw material or part they should buy.
In the past few decades, different sorts of companies, including pure ecommerce operations, omnichannel retailers, and direct-to-consumer brands, have used the EOQ to calculate the ideal amount of inventory to purchase from a particular supplier to minimize the cost of buying and holding.
The model starts with an understanding that the total cost of buying inventory is the sum of the purchase cost (the price of the product), the ordering cost, and the carrying cost.
Total Cost = Purchase Cost + Ordering Cost + Carrying Cost
A Balancing Act
Purchasing inventory is something of a balancing act.
Buying too little inventory results in out of stocks, disappointing shoppers and foregoing profits.
But too much inventory is a problem too. Where will the retailer put the inventory? And what happens to that inventory as it ages? Will it spoil or become obsolete?
This balancing act is what the EOQ tries to solve, using an equation that identifies ordering cost, demand, and carrying cost.

The economic order quantity or optimal order size is the square root of two times the ordering cost times the demand for a given timeframe divided by the carrying cost per unit.
Ordering Cost
Ordering cost, also called the setup cost, is the expense of placing an order (not the price of the goods, which is the purchase cost).
Thus, ordering cost might include freight and the time your company’s purchasing team spends researching and placing the order.
For example, imagine a DTC brand that manufactures its product in Taiwan. With each production run, the brand sends a quality engineer from its office in Los Angeles to the facility in Taiwan. The trip is part of the ordering cost.
On a smaller scale, a purchasing agent might submit an order, arrange the freight, and allocate that inventory to a few warehouses. The agent’s time should be used to estimate a fixed cost per order.
Imagine that the ordering cost of a product is $100. We can place this number in a Google Sheet.
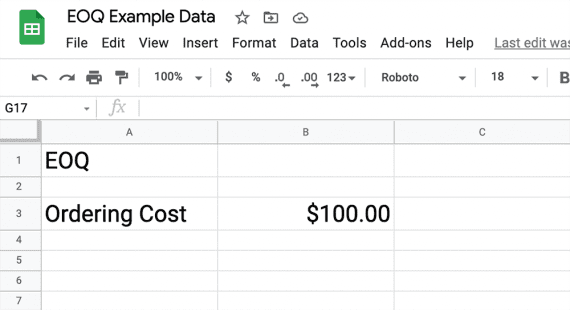
Ordering cost is the cost of placing or processing an order.
Demand
For the EOQ equation, demand is the number of units your business will purchase in a given timeframe, typically one year, reflecting the number of units you expect to sell.
A weakness of the EOQ model is that it does not account for seasonal spikes in demand. For this reason, it may be necessary to adjust the timeframe.
In our example, let’s imagine that demand is 10,000 units per year.
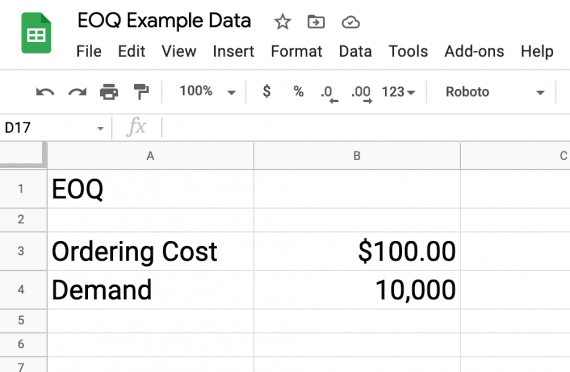
The EOQ demand is the number of units your business will purchase for some timeframe, such as one year.
Carrying Cost
Carrying cost, which is sometimes called holding cost, is the expense of storing or holding unsold inventory for a particular timeframe (the same timeframe as for demand).
Carrying cost is often shown as a percentage of total inventory value. But for our EOQ equation, we want a monetary amount per unit. So we will start by calculating the carrying cost percentage and then multiply it by the unit cost.
Inventory carrying costs typically include the costs of capital, storage, servicing, and risk.
- Capital costs are the opportunity or interest costs associated with buying inventory. Imagine you bought $100,000 in inventory. If your business could have earned 5 percent by investing that money, the capital is costing 5 percent. Similarly, if you have to borrow to buy inventory, the interest is a capital cost.
- Storage costs are a product’s share of warehousing costs, including the rent or mortgage, overhead, and similar.
- Servicing costs are expenses related to holding a product, such as insurance, software, and labor.
- Risk includes shrinking, spoilage, and obsolescence.
Added together, these costs result in “inventory carrying (or holding) sum.” That figure is divided by the total value of the inventory and multiplied by 100 to get a percentage.
Carrying Cost (%) = Inventory Carrying Sum / Total Inventory Value * 100
We then multiply the carrying cost percentage by the cost per unit.
For our example, we can say that it costs 20 percent to carry inventory and our unit cost is $10. Thus our carrying cost per unit is $2.
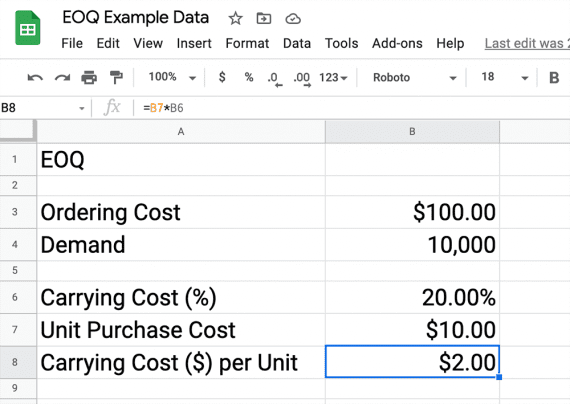
Calculating carrying cost takes a little work. It requires understanding the capital costs, storage costs, service costs, and risks associated with holding inventory.
Calculate the EOQ
Having identified the ordering cost, the demand, and the carrying cost per unit, we are ready to calculate the EOQ or optimal order size, which is Q* in our equation.

The economic order quantity or optimal order size is the square root of two times the ordering cost times the demand for a given timeframe divided by the carrying cost per unit.
This is a straightforward calculation in Google Sheets and Microsoft Excel. The formula is the same in both. Here is what it looked like in a Google Sheet.
=SQRT((2*B3*B4)/B8)
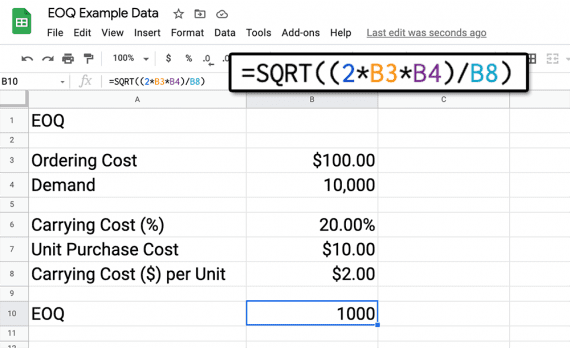
Calculate the square root in a spreadsheet.
In this case, it would make the most sense to order 1,000 units ten times throughout the year.
Remember, the EOQ aims to reduce your company’s total cost of purchasing inventory by calculating the optimal order size. EOQ then is a way to improve your business’s bottom line.
EOQ may be best for products with relatively stable demand. If your goods have strong seasonal demand, consider experimenting with the timeframe.


