In October 2011, Google made a significant change that impacted search engine optimization. To improve security, Google updated its SSL, encrypting search queries. The result was much less info about searchers’ organic keywords, the blue links they clicked, and the subsequent landing pages. In analytics, the keyword stated, “[not provided].”
Search optimizers erupted. How could we know which keywords to focus on? Which keywords drove profits? Our anger turned to conspiracy since Google passed similar keyword data to advertisers, suggesting that if you want data, you have to buy Google ads.
How could we know which keywords to focus on?
The months after that update were tough. SEOs had to explain to their bosses and clients why new organic-search campaigns took longer since the targeted keywords were unavailable. Instead, we looked at rankings data assembled by third-party tools — which, incidentally, Google has always discouraged because of the scraping methods used to obtain this data — and organic traffic and conversion metrics. We had to loosely correlate the missing middle component: the keywords that produced the traffic and conversions.
But several years ago, Google’s Webmaster Tools (now called Search Console) began adding performance reports — giving search optimizers some organic data. Later, the reports became more robust. Then the share of keyword data increased. Google even created an API to obtain hundreds of thousands of keyword metrics. (I addressed this API in a Moz post.)
Search Console now has more than enough data to return us to the glory days of natural search keyword data. But many businesses are not aware. I use the Search Console report often, more than Google Analytics and my rank tracker.
I’ll explain the Search Console data in this article.
Search Console
Google Search Console is a free portal to help webmasters understand how their sites appear in Google.com. (If you’re not on Search Console, follow Google’s instructions for creating and verifying.)
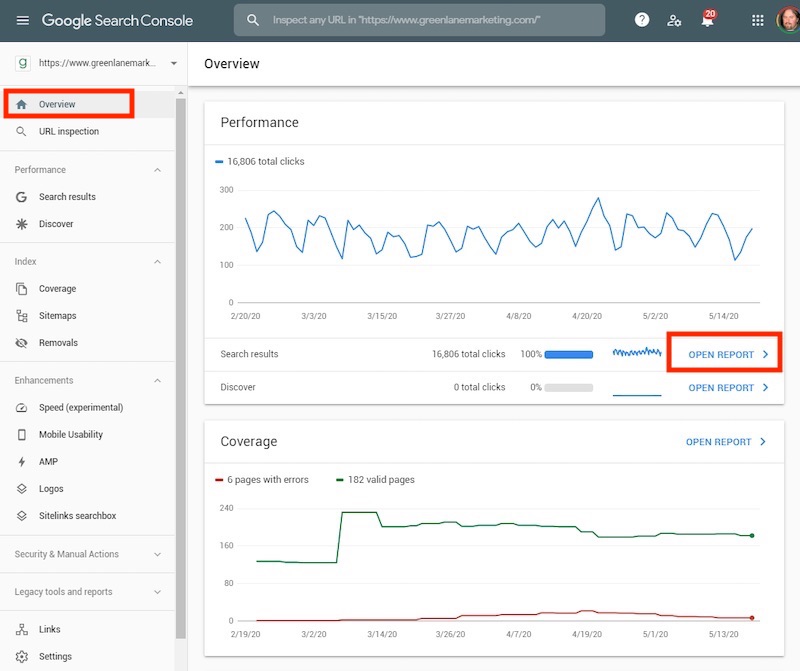
On the left rail of your Search Console account are links to reports and tools, including sitemap submission, mobile usability, and more. But for this post, click “Overview” (or, for some users, “Performance”), which produces a report called “Performance.”
Once there, click the “Open Report” for “Search results” for more information.

In Search Console, click “Overview,” which produces a report called “Performance.”
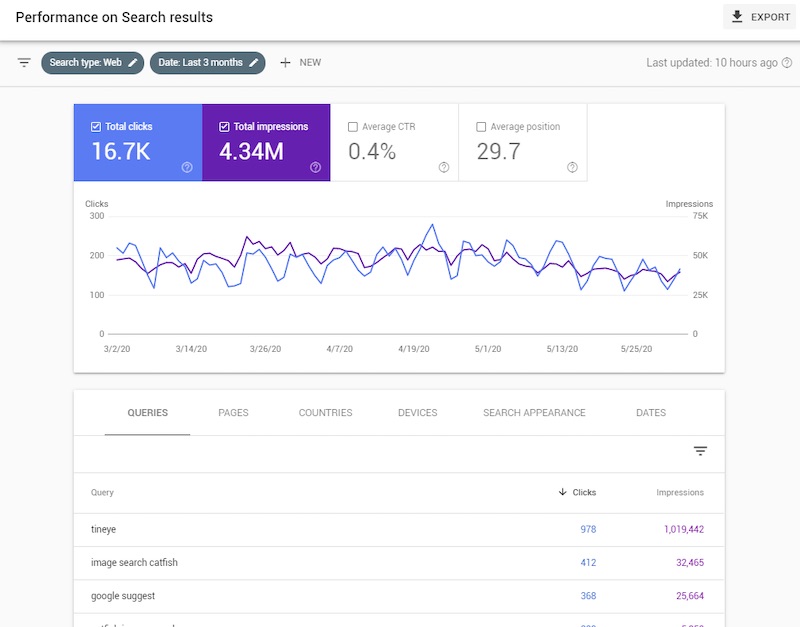
By clicking the colored boxes you can add layers of data to this report.

Click the colored boxes to add layers of data.
Also, clicking the date range can provide even more analytics data — as shown in the following video.
—
To dig even further, click the sub-tabs of “Queries,” “Pages,” “Countries,” and so on.
—
The resulting report is incredibly powerful. By first choosing the page to review, you can then click “Queries” and see the keywords that are driving traffic to it. Moreover, you can see the average ranking position, the clicks Google recorded, the impressions of your page, and the click-through rate. And the data can be exported.
Useful Data
When focusing on specific products or content pages, the Search results “Performance” report is very helpful. Some of the keywords you are targeting. But others you’ve likely never heard of or knew you ranked for.
You could find a term with high visibility, a high conversion rate, and an average rank of 15. That’s page 2 of Google search results. Now, with this insight, you can begin pushing to page 1 with some targeted optimization.
Conversely, you may find that your target keywords are ranking well but have low clicks. You could improve clicks by updating your title tags and meta descriptions to stand more on the results page.
This report is one of my favorite sources for keyword research. Dig deep to find previously unknown keywords. Export the data and append with estimated search volume (which you can obtain from Keyword Planner, Ahrefs, and other SEO tools). You can see the high volume keywords that Google associates with your site. Now it’s time to target them with organic search campaigns.
Data Is Back
I have been doing SEO since the 1990s. I have used many related tools. None are as helpful as this free Search Console report. Take a few minutes to get accustomed to the interface. Our data is back, like the old days.


