Niche ecommerce merchants must focus on cash flow. They do not have large capital reserves to support unprofitable investments. Although growing sales is good for the ego, growing cash flow is what puts food on the table. In this article, I’ll address how to use Google Analytics to track profitability by product category — reporting on sales, cost of goods sold, and advertising expense — to maximize cash flow.
Not all of the data has to come from Google Analytics, by the way. Merchants could use data from other sources, so long as those sources provide:
- Sales by product category;
- Cost of goods sold by product category;
- Advertising cost by product category.
Reporting Sales by Product Category
Google Analytics ecommerce tracking can report sales by product category. To view sales by category, go to Conversions > Ecommerce > Product Performance and select “Product Category.”
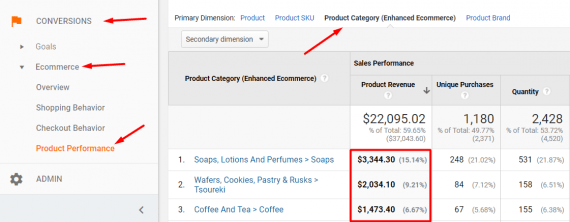
To view sales by category, go to Conversions > Ecommerce > Product Performance.
Reporting Cost of Goods Sold by Product Category
Google Analytics has a feature to import product cost data. To set this up, first create a new custom metric at Admin > Property > Custom Definitions > Custom Metrics.
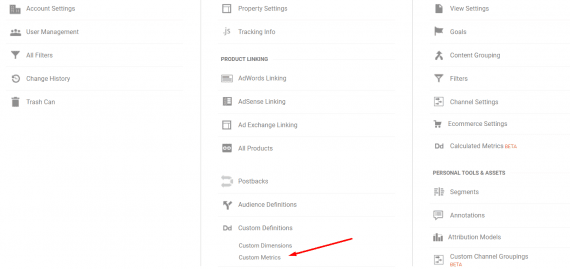
Under “Custom Definitions,” click on “Custom Metrics.”
—
Name the metric “Product Cost” and assign the scope to be “Product” level and the formatting type as “Currency (Decimal).” Leave “Minimum Value” and “Maximum Value” blank.
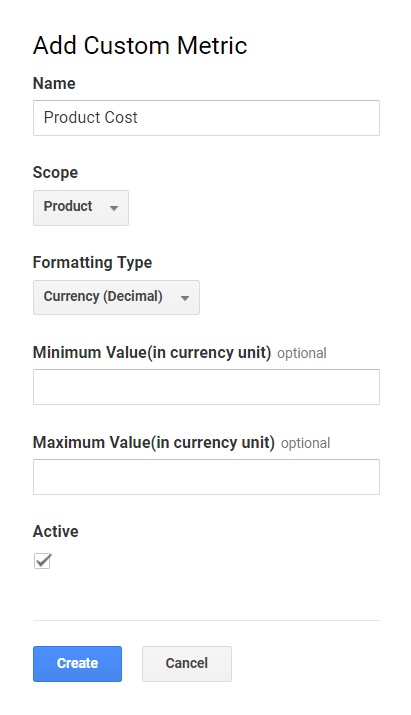
Name the custom metric “Product Cost” and assign the scope to be “Product” level and the formatting type as “Currency (Decimal).”
—
For the data import, go to Admin > Property > Data Import.
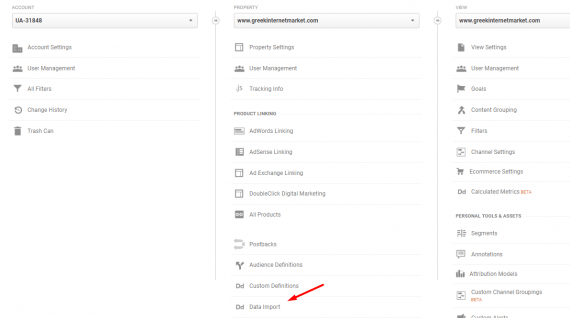
Select “Data Import” under the Property column.
—
Then create a new data set for “Product data.”
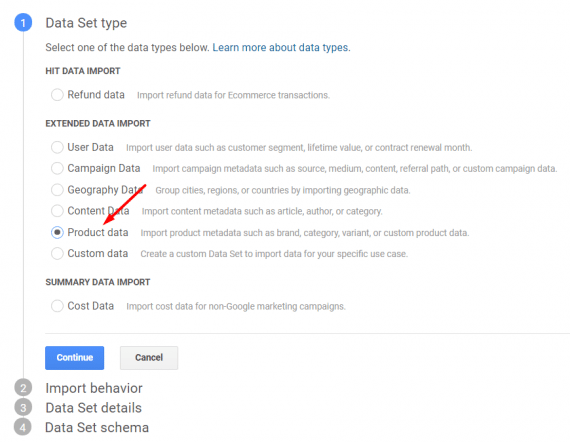
Create a new data set for “Product data.”
—
Name the data set “Product Cost” and select a Google Analytics view to receive the imported data and click “Continue.”
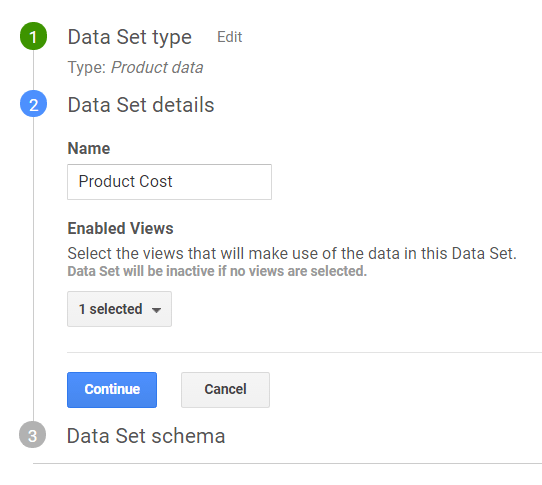
Name the data set “Product Cost.”
—
Then select “Product Cost” as the imported data.
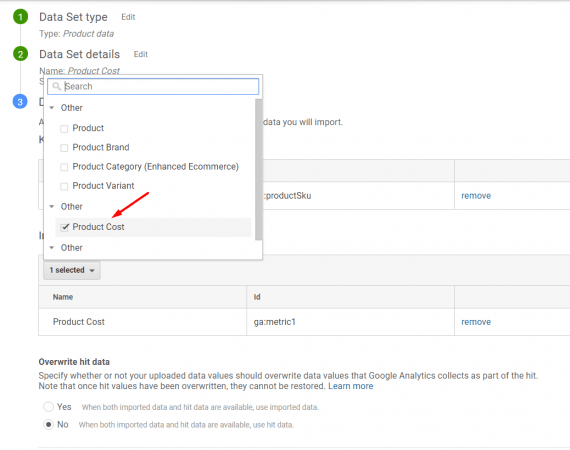
Select “Product Cost” as the imported data.
—
Leave “Overwrite hit data” set to “No” when both imported data and hit data are available. Save and then click on “Get schema.”
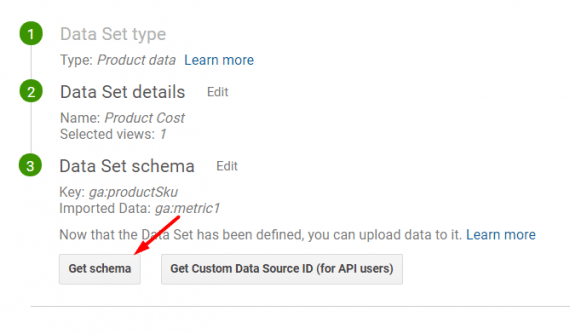
Leave “Overwrite hit data” set to “No” when both imported data and hit data are available. Save and then click on “Get schema.”
—
Click on “Download schema template” to get the template to populate product cost data.
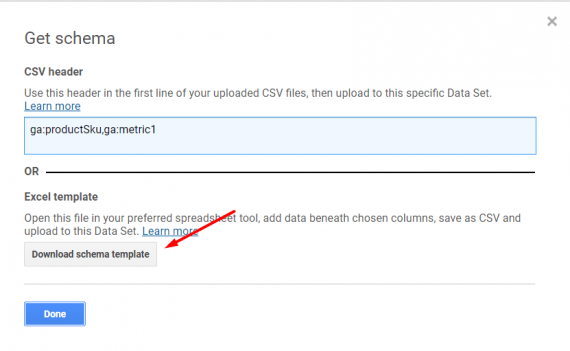
Click on “Download schema template” to get the template to populate product cost data.
—
Populate the schema template with all product SKUs and their per-item cost.
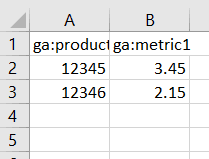
Populate the schema template with all product SKUs and their per-item cost.
—
Then save the schema template and go to “Manage uploads” to upload the product cost data.

Go to “Manage uploads” to upload the product cost data.
Note that the product cost import is not retroactive (unless you are using Google Analytics 360, the enterprise version). So product cost will start populating after you import an SKU and its cost.
Create a “Calculated Metric” for cost of goods sold by going to Admin > View > Calculated Metrics.
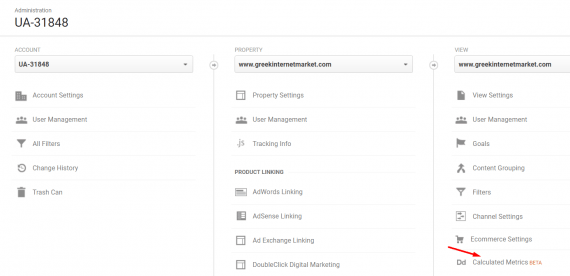
Create a “Calculated Metric” for cost of goods sold by going to Admin > View > Calculated Metrics.
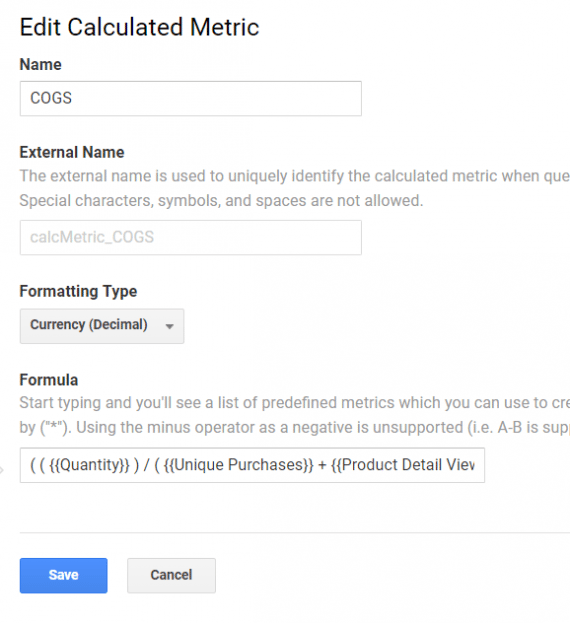
Name it “COGS” and set the Formatting Type to “Currency (Decimal).” Enter the following formula.
( ( {{Quantity}} ) / ( {{Unique Purchases}} + {{Product Detail Views}} + {{Product Adds To Cart}} ) ) * {{Product Cost}}
—
Name the Calculated Metric “COGS” and set the Formatting Type to “Currency (Decimal).”
—
Create another Calculated Metric called “Product Profit” — which is also formatted as “Currency (Decimal)”) — using the following formula.
{{Product Revenue}} - ( ( ( {{Quantity}} ) / ( {{Unique Purchases}} + {{Product Detail Views}} + {{Product Adds To Cart}} ) ) * {{Product Cost}} )
—
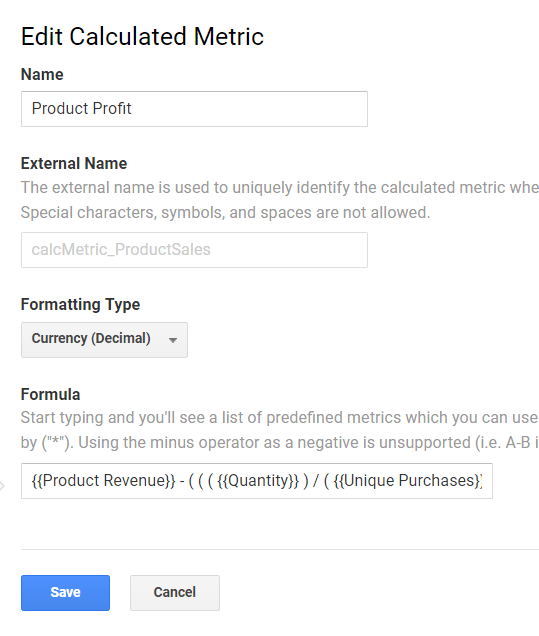
Create another Calculated Metric called “Product Profit.”
—
You are now ready to report gross profit — sales less cost of goods sold — by product category. Here is the custom report that will provide this data.
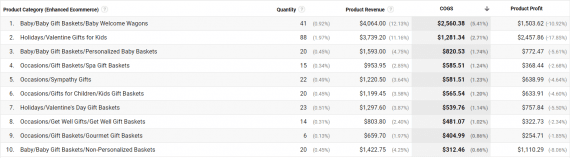
Use this custom report for gross profit by product category. Click image to download.
If you cannot access or save my report, you can develop your own, at Customization > Custom Reports > New Report. Use the followings settings in the “Report Content” section.
- Type: Flat Table
- Dimensions: Product Category (Enhanced Ecommerce)
- Metrics: Quantity, Product Revenue, COGS, Product Profit
Reporting Advertising Cost by Product Category
Setting up a reporting dashboard to track gross profit after advertising cost enables merchants to identify which categories generate the most cash flow. The optimal way to report advertising cost by product category is to structure advertising campaigns and ad groups to align with product categories. That way Google AdWords, Bing Ads, and other campaigns and their ad groups can be combined with category sales to report gross profit after advertising.
Google AdWords cost data should be available in Google Analytics if you have integrated AdWords with Analytics. You can import into Google Analytics the cost for Bing Ads and other advertising channels. I explained how to set this up at “Using Google Analytics to Optimize Bing Ads, Other Channels.”
Advertising spend reports are at Acquisition > Campaigns > Cost Analysis or you can create a custom report for output you need.
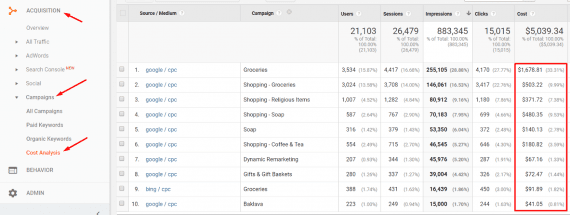
Find advertising spend reports at Acquisition > Campaigns > Cost Analysis.
Putting It All Together
Having set up the Google Analytics reporting detailed above, we then generate two reports to assemble a “Gross Profit after Advertising” report.
- Gross Profit by Category
- Advertising Cost by Category
Export those reports from Google Analytics and combine into a spreadsheet. Name the spreadsheet “Gross Profit after Advertising” and it’s done. You can now track profitability for each of your product categories.
Editor’s Note: This article was updated on June 13, 2017.