Ecommerce merchants presumably want to convert as much traffic to sales as possible. The Google Analytics metric “Ecommerce Conversion Rate” gives merchants broad insight into their site’s conversion status. But merchants need additional data to identify where shoppers are abandoning during the path to purchase. Creating goal funnels can help.
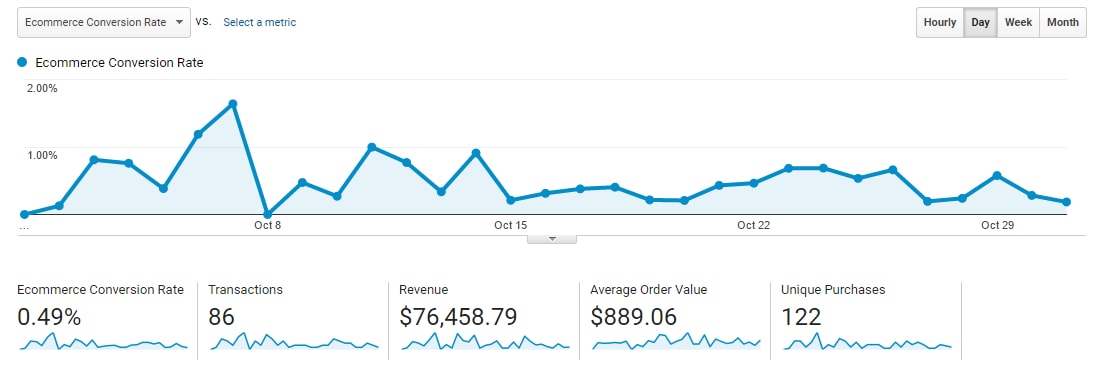
“Ecommerce Conversion Rate” gives merchants broad insight into their current status for converting traffic to sales.
There are two ways to set up goal funnels in Google Analytics:
- Create goals and funnels in the Admin;
- Set up funnels in Enhanced Ecommerce.
In this post, I’ll introduce both methods and focus on the first — creating goals and funnels in the Admin — because it is faster and easier.
Creating Goals in the Google Analytics Admin
Google Analytics has a section in the Admin tab called “Goals,” which is under the Admin’s “View” column.
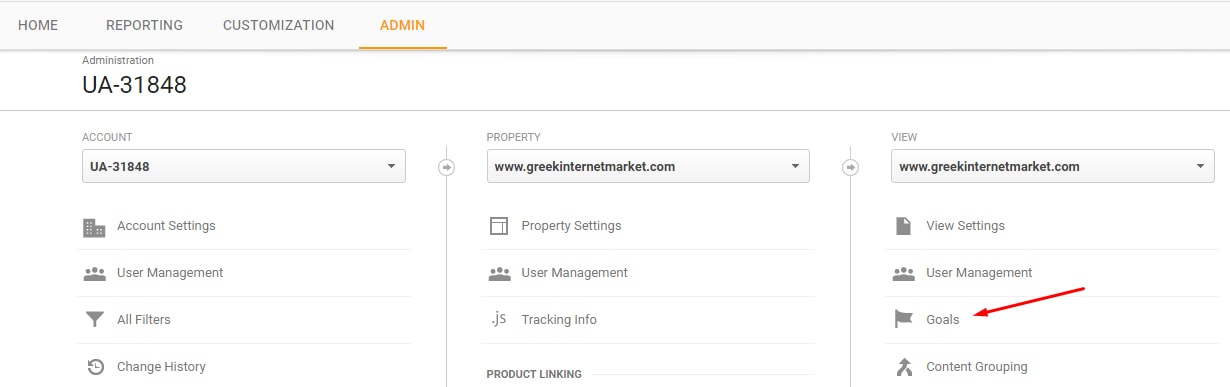
You can find “Goals” under the “View” column in the Admin tab.
What follows is an example for setting up a checkout funnel. The funnel starts at the cart page and ends on the invoice-receipt page. This funnel will focus on the checkout steps to identify where users are exiting the checkout process.
The first step is to create a new goal and select “Place an order” as the template to use for the goal funnel.
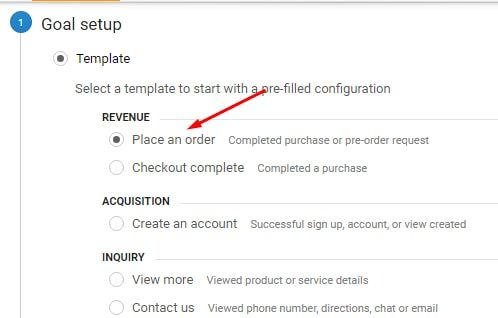
Create a new goal and select “Place an order” as the template.
If you do not see this option, select “Custom” and proceed to the next step.
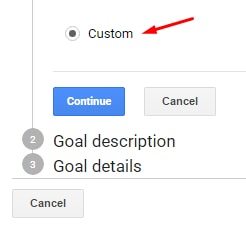
Select “Custom” if “Place an order” does not appear on your version of Google Analytics.
Name the report and select “Destination” as the Type.
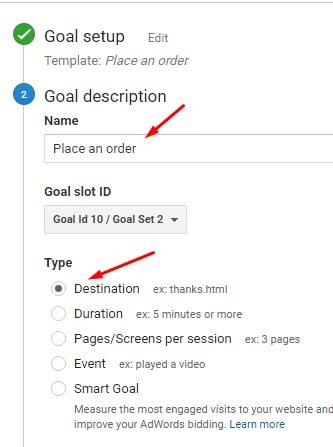
Name the report and select “Destination.”
The next step is a little more challenging. The Goal “Destination” needs to be defined. This should be the invoice-receipt page or order confirmation page. You can find the URL when placing an order on your website.
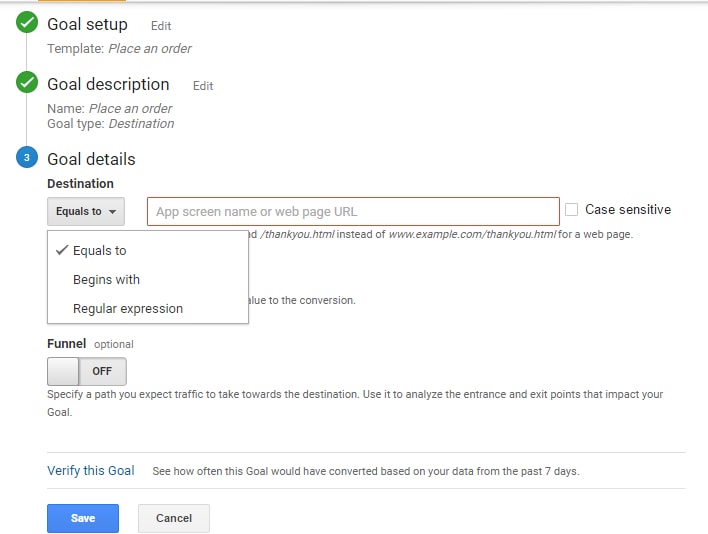
The Goal “Destination” needs to be defined. This should be the invoice-receipt page or order confirmation page URL.
Here are some pointers on setting up this URL.
- Beware dynamic URLs. If your checkout pages use dynamic URLs, consider hiring a consultant to set up a Goal funnel. Dynamic URLs on checkout pages do not change. For example, the checkout URLs on my Miva Merchant website all look the same: https://www.greekinternetmarket.com/mm5/merchant.mvc?. The same URL shows up for the payment page as the invoice-receipt page. I did custom coding to get the goal funnel to work.
- Test the URL and the filter applied to it. The URL and the filter applied to that URL — “Equals to,” “Begins with,” or “Regular expression” — can be confirmed as working correctly by clicking on the “Verify this Goal” link at the bottom of the goal settings.
You can also go to your content reports to test the URL settings. For example, if you think the correct setup is to use “Begins With” and then “/funnel_G1/checkout.html”, try that filter in the Behavior > Site Content > All Pages. When you apply the filter, the page should show up. If it doesn’t, the goal will not report correctly.
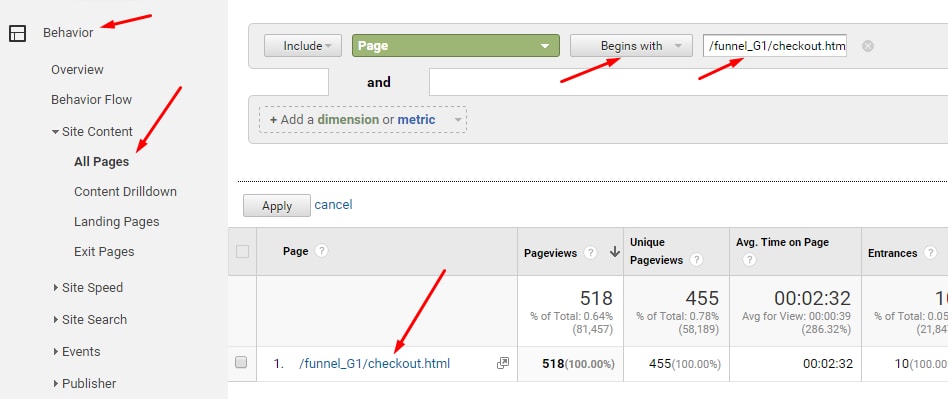
If you think the right setup is to use “Begins With” and then “/funnel_G1/checkout.html”, try that filter in the Behavior > Site Content > All Pages.
Once you have the destination set, leave the “Value” setting “OFF” because the Value is typically set for goals other than ecommerce.
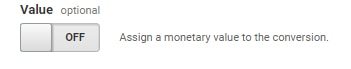
Once you have the Destination set, leave the “Value” setting “OFF.”
The final step is to define the funnel. Enable “Funnel” and define each of the steps during checkout.
- Step one should be your cart or basket page. I typically do not make that step “Required” because some websites do not force a customer to touch the cart page to complete the checkout.
- The remaining steps should be defined with names you can understand. I often use the checkout breadcrumb names or checkout names defined for the customer in each step.
The names of the checkout Breadcrumbs are handy for defining each step in the funnel.
Make sure each checkout step “Screen/Page” can be found in your “Behavior > Content > All Pages” report just like the example above for the Destination URL.
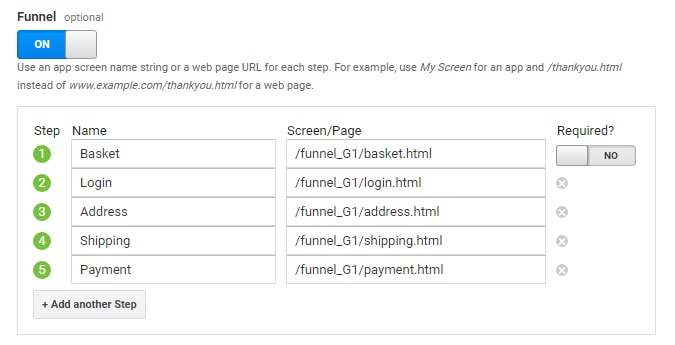
Each checkout step “Screen/Page” can be found in the “Behavior > Content > All Pages” report.
The goal will not report retroactively. It will only report data starting on the date you created it. But it will backfill for that day, which is nice, especially if you created the goal later in the evening.
Viewing Goal Funnels in Google Analytics
To view your funnel, go to “Conversions > Goals > Funnel Visualization.”
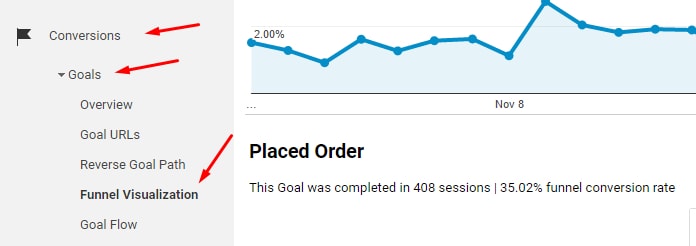
To view your funnel, go to “Conversions > Goals > Funnel Visualization.”
Here is how the funnel visualization is structured. At the top of the report, note the total sessions that completed the goal and the conversion rate for sessions that started the funnel and completed the funnel.
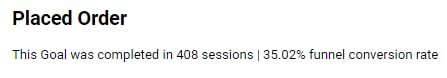
At the top of the report, you will see the total sessions that completed the goal.
For each step, there are up to five previous pages leading to it. For example, for the “Basket” page below, 1,039 sessions reached that step and the top page leading into the Basket page was “/mm5/merchant.mvc.”
From the Basket page, 430 sessions did not proceed to the next step and the top five pages that were visited are listed on the far right. The top subsequent page was the Basket page itself (/funnel_G1/basket.html) before the sessions went somewhere else and did not complete a purchase. This is an example where the page refreshed for some reason — Google Analytics will report that page view.
As shown below, 609 sessions, or 58.61 percent of the 1,039 sessions that touched the Basket page, proceeded to the next step.
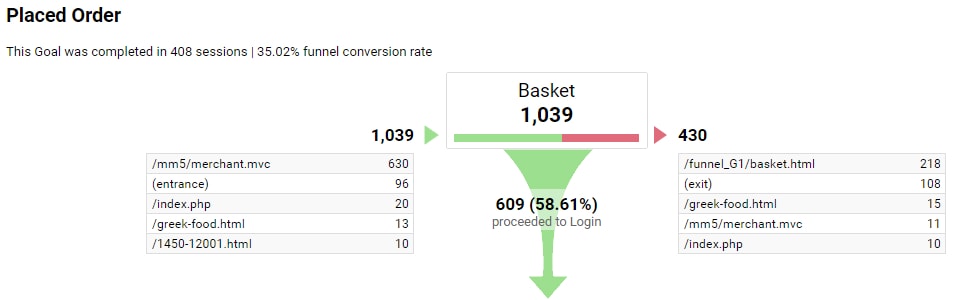
In this example, 609 sessions that touched the Basket page proceeded to the next step.
Follow the funnel down the page to observe all steps, with their proceed rates and their abandonment rates.
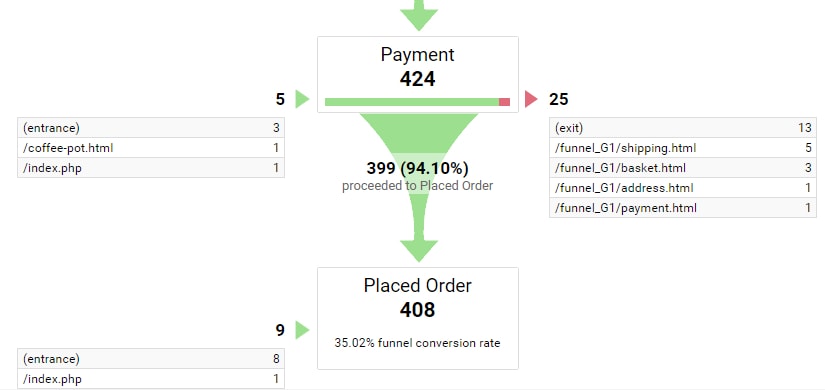
Follow the funnel down the page to observe all steps.
Improving Conversion Rates with Goal Funnels
With a functioning goal funnel for the checkout process, identify which steps have the highest abandonment. Start with the final step and work your way up the funnel.
In the example above, 94.10 percent of sessions proceeded to Placed Order from the Payment page. That’s pretty good, but if that rate was much lower, I would focus on the Payment page because the shoppers have browsed the site, added to cart, and entered all of their billing information. They want to purchase, but 5.9 percent (100.00 percent less 94.10 percent) of them left the Payment page for some reason.
Brainstorm reasons for why you may see high abandonment rates on certain pages. Compare your checkout page to your competitors.
- Do you offer all popular payment options?
- Is your shipping expensive? Should you test free shipping offers?
- Do you force shoppers to create an account during checkout?
- Are the checkout forms confusing?
- Do you get calls or emails from shoppers who say their credit cards don’t work on your website?
- Do you communicate key information on the checkout, such as when orders should ship and when they should arrive for standard ground shipping and expedited shipping?
Use the funnel reports to measure the impact from changes during checkout.
- Using the Annotations feature in Google Analytics, mark the date that you make an update to checkout.
- Assess the impact of your changes after the update.
- Use funnels for continuous improvement.