Everyone wants to be data-driven these days. But, what does that really mean? Using the classic “people, process, technology” triangle, it is tempting to see technology as the most critical factor in becoming data-driven.
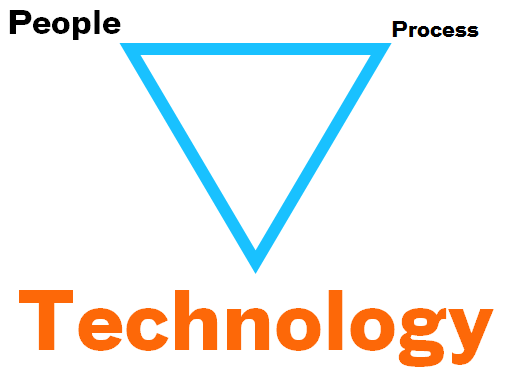
It is tempting to view technology as the biggest key to becoming data-driven.
After all, technology is required to capture the data, and technology is necessary to actually access and crunch the data. But, this is a distorted view. Technology alone, especially when it comes to data, is a critical component, but it is by no means the dominant part of the triangle.
Most analysts, in fact, see the triangle another way.
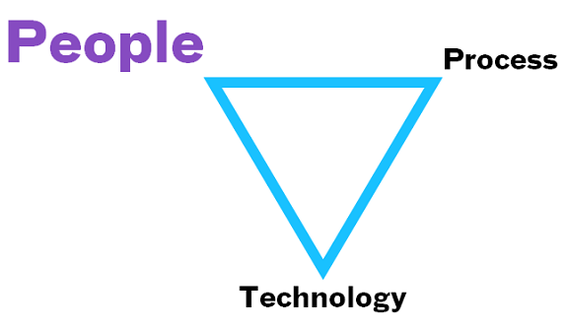
Most analysts see people as the most important part to becoming data-driven.
Avinash Kaushik, the web analytics consultant and author, proposed “10/90 Rule for Web Analytics Success” back in 2006. Simply put, his theory — which was a response to what he saw as an over-emphasis on analytics technology — was that, for every $100 spent on analytics, only $10 should be spent on technology, while $90 should be spent on really good analysts. As a response to the “technology is the answer” siren song, it’s hard to argue with the 10/90 rule.
What both perspectives miss, though, is the third leg of the triangle: process. To be truly data-driven, people and process are equally important, and both trump technology.
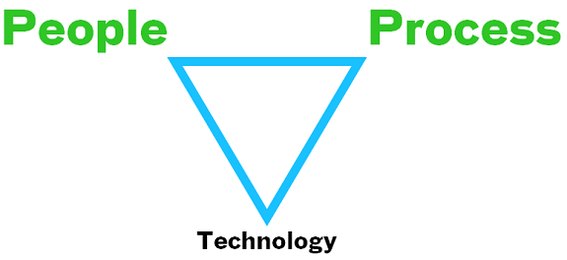
“People” and “process” are equally important in becoming data-driven.
Establishing and managing a process that is designed to discover, prioritize, test, and act on as many hypotheses as possible is the only way to become truly data-driven. The data fuels the process, but the process is what actually enables the organization to reorient to a point where every activity is informed by validated learning.
What does such a process look like?
It does not require fancy tools, new staff, or a massive amount of time to implement. With a little bit of planning, a commitment to on-going management, and some cheap or even free technology, you can implement an “A.D.A.P.T. to Act and Learn” process, as follows.
- Align on goals and key performance indicators.
- Discover hypotheses across the company.
- Assess the hypotheses and the best approach for testing them.
- Prioritize the hypotheses.
- Test the highest priority hypotheses.
- Act on the results — report the results and then track to ensure action is taken.
- Learn for the future — capture and apply deeper learning that can be shared across the organization.
At the core of this process is a “hypothesis library” — a way
to capture each new hypothesis that is generated, and then track it all the way through to action and results. You can download a sample hypothesis library as a Google spreadsheet or an Excel file.
Align
The first step in this process is to ensure that you have clearly defined goals and key performance indicators — KPIs — for your site. Before skipping past this step, ask these questions.
- Do I have 2 to 4 specific measures that I use to gauge the performance of my site?
- Do I have documented targets for each of those measures?
If not, figure those out. My one-page Guide to Getting to Great KPIs PDF might be a good reference.
With those KPIs, develop a dashboard that is structured according to the goals and that is as automated as possible. You don’t want to spend your limited time for analysis producing recurring reports.
Discover
The most actionable analyses come from clearly articulated hypotheses. Chances are many people in your organization have hypotheses that could drive positive action, even if few of them think of their ideas and questions as hypotheses.
Think of a hypothesis as no more than a statement of the form, “I believe ‘x.’” For instance: “I believe the ‘Shop Now’ link in our global navigation doesn’t ‘pop’ enough to be readily seen by visitors.” Or, “I believe many people coming to our site just want to know where the nearest store is rather than to shop online.”
In addition to simply gathering hypotheses, get an initial validation of their actionability by adding a second fill-in-the-blank statement: “If I am right, we will ‘x.’” This second question helps minimize overly vague hypotheses: “I believe our home page is bad,” for instance, becomes a clear problem when trying to complete the second sentence: “If I am right, we will ‘make the site better.’”
List your own hypotheses. Solicit them from others. Store them in a hypothesis library that can have new hypotheses added at any time.
Assess
Each hypothesis that gets added to the hypothesis library needs to be promptly assessed on two fronts.
- Is it clearly articulated and specific? If not, then get clarification from the person who submitted it. Sometimes, what is entered as a single hypothesis is really 2 or 3 hypotheses rolled into one. This needs to be teased out and corrected.
- What is the best way to test the hypothesis? Analyzing data from Google Analytics? Running an A/B test? Mining the responses to your site survey? See “Effective Analytics: Using the Right Tool for the Job,” my earlier article, for a list of the many different types of tools available to you for testing hypotheses.
This assessment is a key input into the prioritization — both assessing the effort required to test the hypothesis, as well as to factor in practical considerations about available resources to implement the approach.
Prioritize
Prioritization of hypotheses is never a wholly formulaic exercise. But, by thinking through the different factors that drive your priorities, you can develop a formula-based approach that will bubble promising hypotheses to the top of the list for consideration, and that will push the obvious priorities down to the bottom.
Factors may include the following.
- Effort and time required to test the hypothesis.
- The likelihood the belief in the hypothesis is actually right.
- If that belief is right, the likelihood a change would be implemented. For instance, if the hypothesis is that your home page hero image should be product-oriented rather than branding-oriented, but the CEO insists that it be branding-oriented, then there may be no point in running a test to prove him wrong.
- If a change gets made, the likely business impact expected — this is inherently a difficult factor to estimate.
- The alignment of the hypothesis with your business goals.
Test
Actually testing the highest priority hypotheses is the next step. Because the earlier steps in the process exist, you will already have a high degree of confidence that most of the hypotheses you test will be actionable, as well as a good idea of the approach you will take to test each one. This makes for a much more efficient use of analytics resources.
Act
Just because an analysis returns actionable results does not mean that action will actually be taken. Tracking to action, then, should also be part of the process, as well as determining when that action should be measured to quantify the impact — a week later, or a month, or three months? — and measuring and reporting the impact.
Learn
Every hypothesis tested should be followed by the question, “Did we gain any deeper learning beyond just this focused hypothesis?” If so, it should be captured.
Regularly Scheduled Reviews
With a process in place that tracks every idea from inception through to action, results, and deeper learning, you will be able to easily review — monthly or quarterly — your investment in analytics and the results you have generated. You will be able to quickly summarize for the entire organization what deeper learning you achieved each period. Perhaps most importantly, you will gently pivot your company to truly being data-driven — to asking smart and specific questions and then validating them using the range of available data available.