The holiday season is fast approaching. As you get your ecommerce products, promotions, and backend processes in place, take your analytics and optimization up a notch. Don’t just focus on the technology; invest in people and processes, too. Here are the 13 pointers to get started.
Technology
Consider a tag management solution, such as Google Tag Manager. This tool provides analytics marketing tags — i.e., conversion tracking code — more efficiently and with less developer dependency.
- Conversion. Ensure all your conversion tracking codes are properly deployed on your transaction confirmation pages. This includes AdWords and Bing in conjunction to other paid search programs, along with affiliate and comparison shopping sites and other media buys.

Make sure your conversions codes are properly deployed on your transaction confirmation pages.
- Remarketing. If you are not remarketing or retargeting, you’re likely missing out. Look at those visitors who add products to your shopping cart and don’t complete the transaction. Retarget them with ads, to entice them to come back to the site and complete the transaction. Plan your retargeting by understanding why visitors leave your site. Are they leaving because of shipping cost at the end of the purchase? If so, target them with an ad offering free shipping on their first purchase.
- Mobile. If you have a mobile site or a mobile app, then track these activities as well. With the Google Analytics mobile SDK for mobile app tracking, you can also leverage the Google Tag Manager.
- Qualitative. In addition to the quantitative measurement for traffic, capture some qualitative insights, too. Engage visitors by asking open-ended questions. Ask if they found what they were looking for. Get to know the whys — consumers visit your site for many purposes. They might be searching for sizes, colors, or models you don’t carry, or they might be leaving because the pricing is not competitive, or maybe that last promotion just didn’t stick. If you don’t ask the question, they won’t tell you. There are many tools — such as Qualaroo — to help with qualitative data gathering. You can integrate those tools with Google Analytics, to segment your data based on visitor’s answers, to find ways to improve the user experience.

Qualaroo lets you ask your customers questions.
- Testing. If you are not testing, you are leaving money on the table. Consider Google Analytics Content Experiments. Identify the goal you are testing, for more efficient reporting and analysis. Remember that the more variations you use in your experiments, the more traffic you need for a valid test. And the longer your test is, the more accurate the results will be.
- Reporting and data visualization. Looking at your metrics individually is helpful. But when you create reports that combine data from your campaign, web, mobile, and backend, you will have a much more actionable reporting set. You can do wonders with Excel. For more advanced needs and budgets, consider data visualization tools like Tableau to quickly see trends and how particular metrics are performing over days, weeks, or months and to compare values against each other. Move beyond aggregate data and organize your reports in ways that provide overall insight.
Process
Your internal processes will determine how efficient and consistent your analysis is. Here are three suggestions.
- Campaign tagging. Remember the five Ps: Previous planning prevents poor performance. This is especially true when it comes to campaign tagging. If you don’t properly identify your campaigns in your analytics tool, you’ll have little or no visibility into campaign performance. For example, email traffic can show as referring traffic, your paid search can show as organic traffic, and you’ll have little clue on how your display program is performing. Make sure the same process is followed by everyone involved in your marketing initiatives for tagging campaigns, and that you assign visitors from all sources to the proper campaigns. In Google Analytics, Google’s URL builder can simplify this process and make it much easier to properly segment your data.
- Reporting. Assess how you will be reviewing your data. Some co-workers may prefer a native analytics interface, or standard or custom Google Analytics reports. Others live and die by Excel. Some business owners will not understand it if it is not in a PowerPoint presentation. Some want more advanced data visualization tools like Tableau. All of these methods require time and effort. Someone needs to create the reports, export the data, and massage it. Plan your resources to ensure that there is easy access to reports in the format and frequency required. Schedule extra time if you are planning on stitching data from different sources. Allow more time if you are working with large data sets, such as in Google Analytics Premium.
- Data quality: Ensure you have a verification process when code is added to the site. I have seen analytics code inadvertently removed and data lost and can’t be retrieved. Don’t let that happen.
People
Look at the people involved in your online marketing initiatives and especially the roles they play in improving your analytics.
- Commit resources and expertise. When choosing an analyst, look for someone who is business savvy and inquisitive — someone who is comfortable with data and understands customer service. Experience as a trainer and a presenter — someone who likes the numbers, but isn’t afraid to get up and talk about them — is helpful too.
- KPIs and metrics. Identify and assess the key performance indicators that are important to your business. Listen to everyone on your team — business, marketing, and product support — to determine what to include in your analytics reporting. On the business side, you likely should monitor revenue, conversion rates, average order size, and new customer versus returning customer sales — daily, weekly, and monthly. From a marketing perspective, you will likely need traffic data, sources of that traffic, and time on the site, along with page views per visit, events — key user interactions — and more. For product support, consider tracking customer service email, phone calls, and chat counts with corresponding average resolution times for each. There are many more metrics for a well-planned and well-executed analytics initiative.

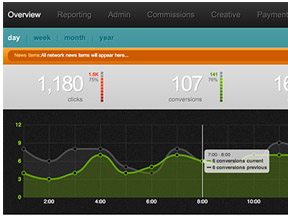
Tracking key performance indicators in a dashboard helps highlight changes, trends.
- Training. An analytics plan is only as good as the people who implement it. Make sure that those involved are up to speed on what data is being tracked, why each metric matters, and how to access reports for their KPIs. Hold training sessions to make sure everyone understands. Seek input from team members, giving them the opportunity to voice concerns and ask questions.
- Analysis and actionable insights. Allow for time to act on your findings. This is why we use analytics. If your conversion rate drops by 10 percent, dig deep into the data to find root causes. Maybe there is a glitch in the shopping cart funnel pages, or the landing page is loading slowly. Or maybe the offer is unappealing, or you are out of inventory on popular products. Whatever the reason, fast corrective action is essential. So watch your data, and react accordingly.