
Data is key to making informed decisions, especially in the context of ecommerce. But filtering through the maze of available data in Google Analytics can be daunting and time-consuming.
Custom reports and dashboards — two Google Analytics options — can help ecommerce managers quickly access key metrics.
But whilst custom reports are able to drill down to traffic data with virtually no limitations, the format of dashboards is report summaries comprising of a maximum of 12 widgets (boxes), at a maximum of 10 rows per widget. Dashboards can be tailored for specific departments or members of an ecommerce team. They are handy tools for making quick and informed decisions.
Each Google Analytics account has an allowance of 20 dashboards. Here are 10 custom dashboards that every online retailer should use.
1. Perfect Dashboard for Ecommerce (Revenue), by Portent
, by Portent")
Perfect Dashboard for Ecommerce (Revenue), by Portent
For this dashboard, the key metrics that you have access to at a glance are Revenue, Pageviews, Visits, and Sales. There is also a channel-referral pie chart and a “Visits & Revenue” chart. The “Top Landing” pages table is also useful as it displays the top landing pages sorted by page views and average time on site.
You are able to further filter this dashboard by Advanced Segments.
2. Mobile Ecommerce Dashboard, by Justin Cutroni

Mobile Ecommerce Dashboard, by Justin Cutroni
With all 12 widgets put to full use, this dashboard provides tablet and mobile commerce data that is easy to understand. The top widgets (all of which are customizable) that I find useful are as follows.
- High Bounce Mobile Devices. Enables you identify devices that might have responsive or adaptive issues.
- Top Mobile Content. Identifies the most popular pages on mobile and tablet devices.
- Social Source and Action. Is quite useful for understanding social sharing of your content on mobile and tablet devices.
- Mobile Revenue and Average Order Value. Understand revenue and average order value from mobile and tablet devices at a glance.
- Mobile vs. Site Revenue. A pie chart that outlines mobile’s share of total revenue.
- Mobile Cart Abandonment Rate. Helps you identify cart abandonment rates on mobile devices at a single glance.
- Top Mobile Products. Know what your top 10 selling products are on mobile devices (including tablets).
3. ResponseTap Ecommerce Dashboard, by ResponseTap
This is a quick-to-understand ecommerce dashboard that focuses on transaction metrics. My favorite widgets are the “Transactions by Day of Week Name” bar chart that displays transactions by day of the week and the “Transactions by Hour” widget, which shows transaction data by hour of the day. An ecommerce manager could use this dashboard to assign more live chat resources over busy periods this report generates.

ResponseTap Ecommerce Dashboard, by ResponseTap
4. SEO Dashboard: Finding Top Content and Keywords, by k3v1np1k3

SEO Dashboard: Finding Top Content and Keywords, by k3v1np1k3
Even with the departure of keyword data, this search-engine-optimization dashboard comes in handy for mid-sized and larger e-tailers, as it reveals keyword data for 5 to 10 percent of organic traffic. It is a must-have dashboard as it reveals:
- Top organic search landing pages;
- Organic landing pages that have generated the most conversions (or goal completions);
- Seven (or more) long-tail keywords that have generated conversions (depending on your conversion settings);
- 5 (or more) keywords, 3 (or more) keywords, 2 (or more) keywords and 1 (or more) keyword that have generated conversions.
5. All-in-one Ecommerce Dashboard, by Paolo Margari

All-in-one Ecommerce Dashboard, by Paolo Margari
This report utilizes the 12-widget dashboard limit with some of the most important ecommerce transaction metrics. The big, colorful bar chart labeled “Ecommerce Conversion Rate by Medium and Device Category,” details the conversion rate of each device type, broken down by desktop, mobile and tablet. There is a “Transaction by Medium” pie chart that details the top six sales referral channels.
There are also corresponding tables for the graphs mentioned above as well as standard ecommerce metrics, such as transactions, conversion rates, and revenue. The other widget worth mentioning is the “Transaction and Ecommerce Conversion Rate by City” report that details transactions and conversion rates by city.
It is possible to apply basic and custom Advanced Segments to filter traffic sources and to filter by products, categories, and even product SKUs.
6. Social Media Dashboard Import, by Justin Cutroni

Social Media Dashboard Import, by Justin Cutroni
This dashboard report is dedicated to a better understanding of social media traffic. Key widgets worth checking out include the following
- “New Visitor Acquisition from Social” report that shows a percentage of new traffic acquired through social media to help understand how it is helping drive traffic to your store.
- “Social Visits & Quality from Mobile” report sheds light on social traffic from tablet and mobile devices.
- One of the most important pieces of data for an ecommerce manager is from the report titled “Revenue and Per Visit Value by Social Network,” which reveals revenue figures from social traffic and well as per session value.
- How is social performing for your brand? This dashboard gives you a view of off-site activity, on-site activity, and conversions and outcomes, making it easier to evaluate user activity throughout the conversion process.
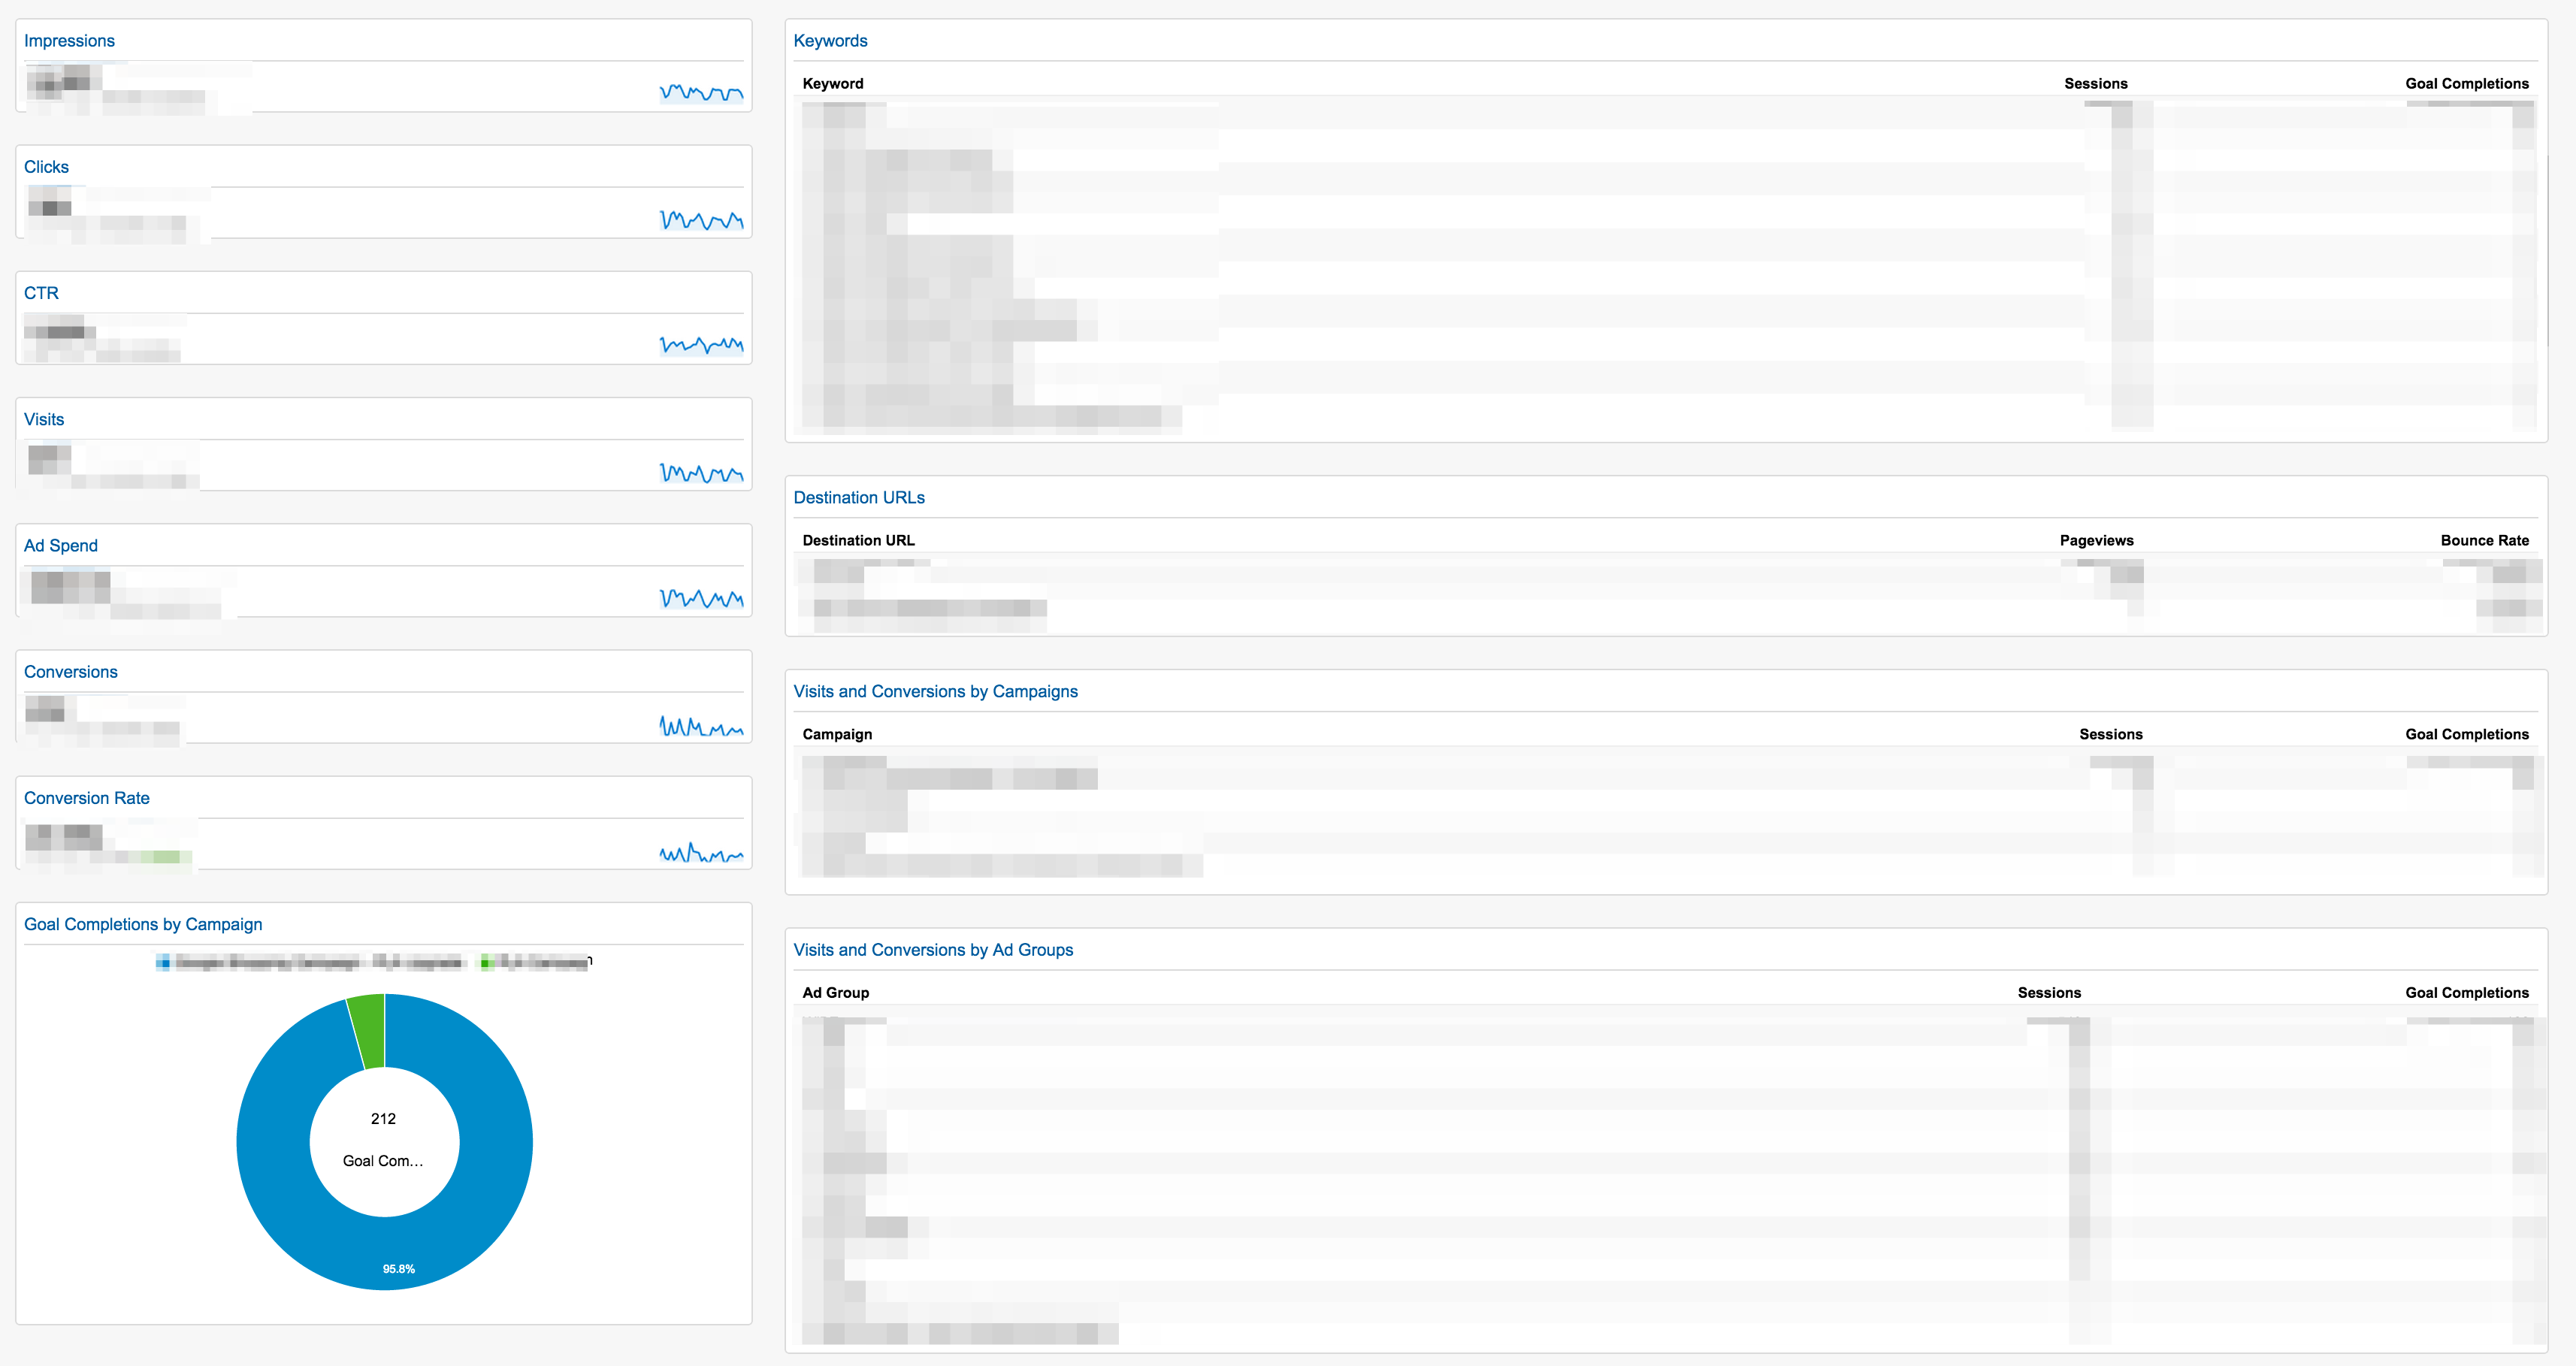
7. AdWords Performance Snapshot, by Loves Data


AdWords Performance Snapshot, by Loves Data
This dashboard provides a quick review of the performance of your Google AdWords campaigns without having to log into your Google AdWords account. The dashboard provides all key AdWords metrics, along with traffic metrics needed for a quick analysis of performance.
The widgets provide data on the top 10 impressions, visitors, click-through rate, ad spend, conversions, conversion rate, keywords, visits and conversions per campaign and ad group. Every widget is clickable to the source data, which reveals a more comprehensive report.
8. Email Dashboard, by Blast Analytics & Marketing

Email Dashboard, by Blast Analytics & Marketing
This email marketing performance dashboard details email marketing revenue, bounce rate, visits, top landing pages from ecommerce, top performing products from email marketing, email campaign performance and geographic (by country) transactional performance.
9. Engagement, Loyalty, and Traffic Growth Dashboard, by Cemal Buyukgokcesu

Engagement, Loyalty, and Traffic Growth Dashboard, by Cemal Buyukgokcesu
This is another dashboard that hones in on device-specific metrics. But rather than transactional data, it focuses on providing engagement metrics specific to desktop, tablet, and mobile devices.
It is a simple and quick way to understand how visitors engage with content on your site from a device standpoint, addressing the following metrics.
- Pageviews by day of the week for each device type.
- Repeat visitor metrics by device type.
- Pages per session and bounce rate by device type.
- The most engaging traffic sources.
The apparent aim of the dashboard is to provide everything you need to analyze for traffic growth insights and to improve engagement and loyalty on your site.
10. 70 Facts about Visitors, by DashboardJunkie.com/70

70 Facts about Visitors, by DashboardJunkie.com/70
This dashboard reveals 70 metrics about visitors to your site, in 10 widgets.
- Top 5 countries your visitors reside.
- Top 5 cities your visitors reside.
- Top 10 browsers.
- Top 5 tablet and mobile devices.
- Brands of devices.
- Top 5 language settings.
- Top 10 screen resolutions.


