With so many local businesses forced to close due to the pandemic, I was excited to see Shopify’s tutorial to help retailers set up a “Buy Online, Pickup Curbside” store.
The fourth step of Shopify’s tutorial suggests a free, customized theme, called Debut.

Shopify’s “Buy Online, Pickup Curbside” tutorial suggests using the Debut theme.
The tutorial is a helpful explanation. But it lacks instructions to optimize the new site for search engines or to speed up the user experience.
In this post, I will share a study I conducted on the page speed of Shopify themes.
Shopify Themes
I recently worked with a developer on a project to help a merchant speed up its Shopify store. We improved the mobile page speed from 23 to 84 on Google’s PageSpeed Insights tool. The desktop speed improved from 77 to 94. We achieved similar improvements across different page types.
But the biggest takeaway was how the Shopify theme impacts the page speed. The merchant had customized the premium theme ShowTime, which was beautiful and feature-rich. Unfortunately, it was also slow. By optimizing the theme files, the developer significantly improved the speed.
Thus, having worked on that project and having observed the Debut theme, I had an idea. What if I ran Google Lighthouse (which includes PageSpeed Insights scores) on all themes in the Shopify store? It could help new merchants locate a fast store and avoid the cost of optimizing a slow theme later.
Page Speed of Themes
Shopify lists 72 themes. Checking the speed of each one manually is doable. But it’s more fun to automate the process as I can collect as many metrics as necessary, and repeat the analysis as themes are updated.
The summary results of the study appear below. The page speed scores are from Google Lighthouse. Note that ShowTime, the theme chosen by our client, is among the slowest in mobile performance. But the theme recommended by the Shopify tutorial, Debut, is near the top. You can sort the table by any column.
| Theme | Page Speed Score: Mobile | Page Speed Score: Desktop |
|---|---|---|
| Simple | 0.92 | 0.99 |
| Editorial | 0.89 | 0.99 |
| Boundless | 0.88 | 0.97 |
| Debut | 0.88 | 0.99 |
| Supply | 0.86 | 0.99 |
| Venture | 0.85 | 0.99 |
| District | 0.83 | 0.94 |
| Showcase | 0.82 | 0.98 |
| Capital | 0.81 | 0.98 |
| Local | 0.8 | 0.98 |
| Narrative | 0.8 | 1 |
| Streamline | 0.79 | 0.99 |
| Label | 0.79 | 0.99 |
| Kingdom | 0.78 | 0.98 |
| Minimal | 0.78 | 0.99 |
| Boost | 0.77 | 0.98 |
| Fashionopolism | 0.74 | 0.97 |
| Modular | 0.73 | 0.98 |
| Grid | 0.72 | 0.97 |
| Brooklyn | 0.72 | 0.98 |
| Expression | 0.7 | 0.97 |
| Sunrise | 0.7 | 0.99 |
| Cascade | 0.69 | 1 |
| Impulse | 0.68 | 0.92 |
| Split | 0.68 | 0.92 |
| Empire | 0.68 | 0.99 |
| Atlantic | 0.68 | 0.99 |
| Symmetry | 0.67 | 0.98 |
| Prestige | 0.66 | 0.96 |
| Ira | 0.66 | 0.96 |
| Kagami | 0.66 | 0.97 |
| Vantage | 0.64 | 0.9 |
| Story | 0.64 | 0.98 |
| Editions | 0.63 | 0.97 |
| Focal | 0.62 | 0.94 |
| Alchemy | 0.62 | 0.94 |
| Artisan | 0.61 | 0.97 |
| Trademark | 0.6 | 0.95 |
| Masonry | 0.57 | 0.88 |
| Testament | 0.55 | 0.94 |
| Pipeline | 0.54 | 0.93 |
| Flow | 0.53 | 0.66 |
| Colors | 0.53 | 0.95 |
| Mobilia | 0.53 | 0.96 |
| Canopy | 0.5 | 0.97 |
| Responsive | 0.49 | 0.93 |
| Avenue | 0.48 | 0.77 |
| Launch | 0.48 | 0.81 |
| Maker | 0.48 | 0.87 |
| Vogue | 0.47 | 0.88 |
| Startup | 0.43 | 0.86 |
| Providence | 0.41 | 0.75 |
| Warehouse | 0.41 | 0.88 |
| Handy | 0.4 | 0.85 |
| California | 0.4 | 0.95 |
| Mr Parker | 0.4 | 0.95 |
| Context | 0.37 | 0.79 |
| Blockshop | 0.37 | 0.81 |
| Icon | 0.36 | 0.93 |
| Broadcast | 0.34 | 0.77 |
| Pacific | 0.34 | 0.81 |
| Reach | 0.33 | 0.81 |
| Venue | 0.33 | 0.81 |
| Motion | 0.32 | 0.8 |
| Envy | 0.31 | 0.81 |
| Parallax | 0.31 | 0.82 |
| Lorenza | 0.3 | 0.67 |
| Galleria | 0.3 | 0.78 |
| Palo Alto | 0.29 | 0.77 |
| ShowTime | 0.25 | 0.83 |
| Loft | 0.23 | 0.86 |
| Retina | 0.08 | 0.58 |
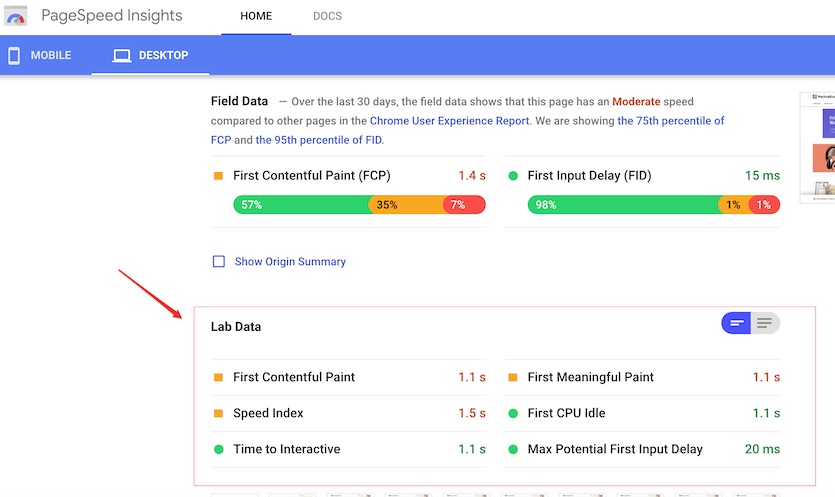
For a compromise between speed and functionality, consider more granular speed metrics. To help, I assembled six such metrics (called “Lab Data” on PageSpeed Insights) on a Google Sheet. Those metrics are as follows.
- First Contentful Paint measures how long it takes to see anything on the page. A good value is less than 1 second.
- First Meaningful Paint measures when the primary content of the page is visible. A good value for this metric is under 2 seconds.
- Speed Index measures how fast the content of a page is visibly populated. Under 4.3 seconds is good.
- First CPU Idle measures how long it takes for the page to accommodate input. A good value is under 4.7 seconds.
- Time to Interactive measures how long the user has to wait for the page to be fully interactive. The page might be fully visible, but still not ready to take input from the user. A fast value for this metric is under 5.2 seconds.
- Max Potential Input Delay measures the worst case of how long it takes the browser to respond to typical tasks performed by a user, such as a click on a button. A fast value for this metric is under 130 milliseconds.
Looking at the detailed metrics provides nuances. For example, the Avenue theme ranks 47th on mobile page speed, but the Max Potential Input Delay is bad at 2,278 milliseconds (2.2 seconds).

For a compromise between speed and functionality, consider granular “Lab Data” speed metrics in PageSpeed Insights. Click image to enlarge.
The Process
I manually produced a list of themes (including their demo site URLs) from the Shopify Themes Store.
Next, I wrote a Python script that reads the list of URLs and runs the PageSpeed Insights API six times per URL: three to obtain detailed mobile metrics and three for desktop. Repeating the tests is essential to account for changes in network conditions. I reported the median results in the Google Sheet.
Recommended

Remembering Hamlet Batista
February 8, 2021
The JSON output returned by the PageSpeed Insights API is a complex, nested structure. I used JSONPath to simplify the extraction process.
I also found JSONPath evaluator to be incredibly useful. I used the handy jsonpath-ng Python library to run the JSONPaths.
What follows are the JSONPaths I used to extract each metric.
jsonpath_first_contentful_paint = parse("$.lighthouseResult.audits.first-contentful-paint")
jsonpath_first_meaningful_paint = parse("$.lighthouseResult.audits.first-meaningful-paint") = parse("$.lighthouseResult.audits.speed-index")
jsonpath_first_cpu_idle = parse("$.lighthouseResult.audits.first-cpu-idle")
jsonpath_interactive = parse("$.lighthouseResult.audits.interactive")
jsonpath_max_potential_fid = parse("$.lighthouseResult.audits.max-potential-fid")
jsonpath_score = parse("$.lighthouseResult.categories.performance.score")


