Inventory planning is essential for merchants. Overestimating inventory needs can be costly. But underestimating can be costly, too — hurting revenue and profit. Just-in-time inventory preserves cash, reduces storage needs, and lowers the risk of loss.
It is important, therefore, to accurately predict inventory requirements. Google Analytics and Data Studio can assist by providing historical sales and trends.
Historical Sales, Trends
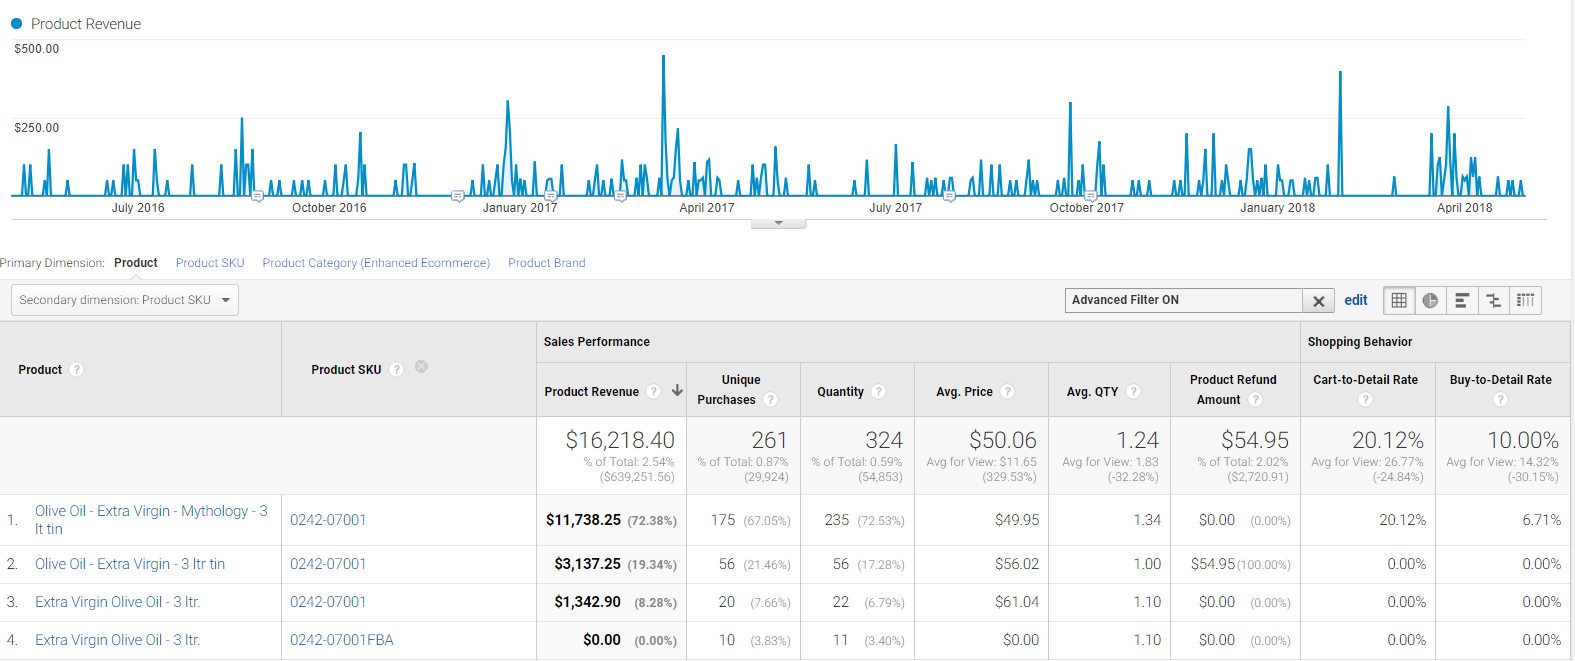
Assuming Ecommerce reporting has been set up (Conversions > Ecommerce), Google Analytics provides historical sales data overall and by product name, SKU, and category. For sales by product, go to Conversions > Ecommerce > Product Performance.
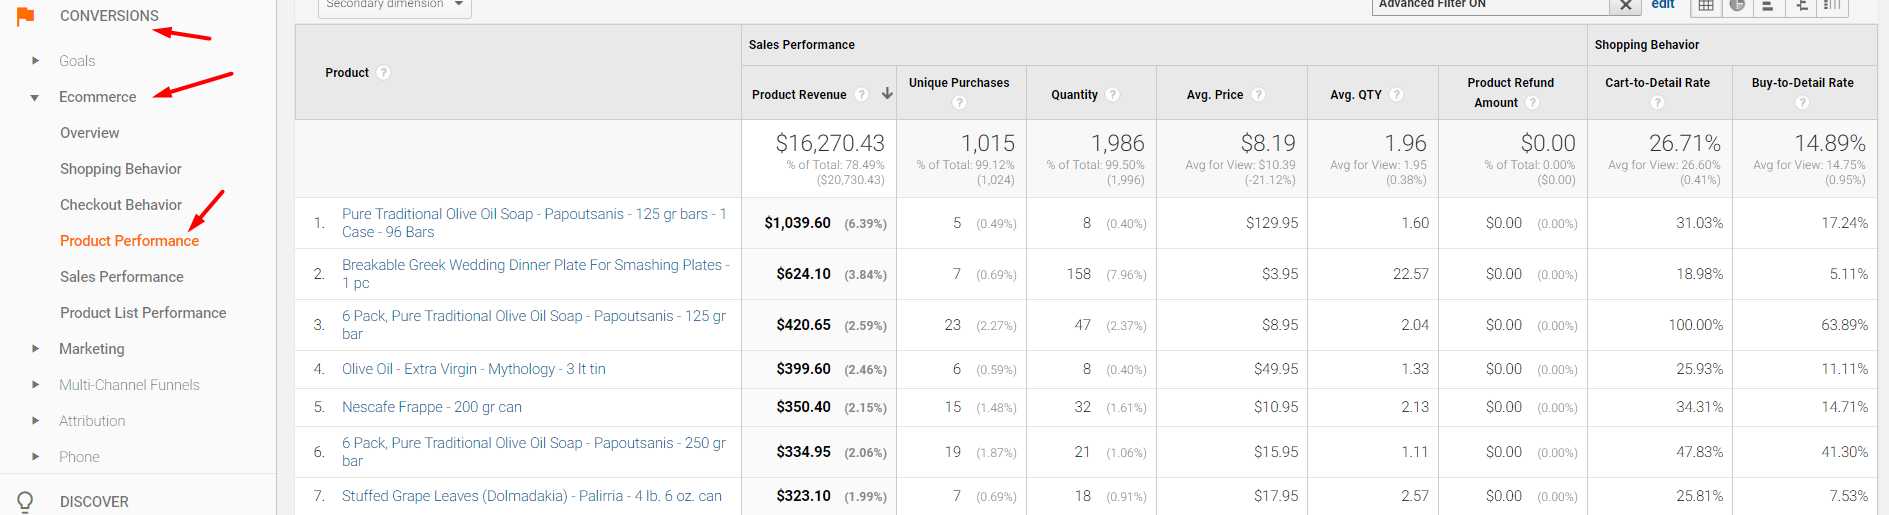
To report sales by product, go to Conversions > Ecommerce > Product Performance.
–
To report by SKU, add a secondary dimension by “Product SKU.”
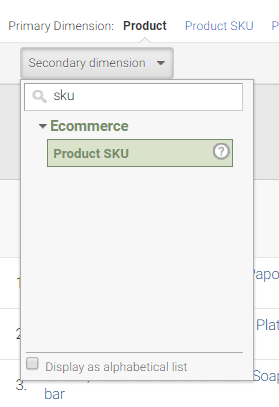
Set secondary dimension by Product SKU.
—
The “Quantity” column shows the number of units sold in the timeframe selected.
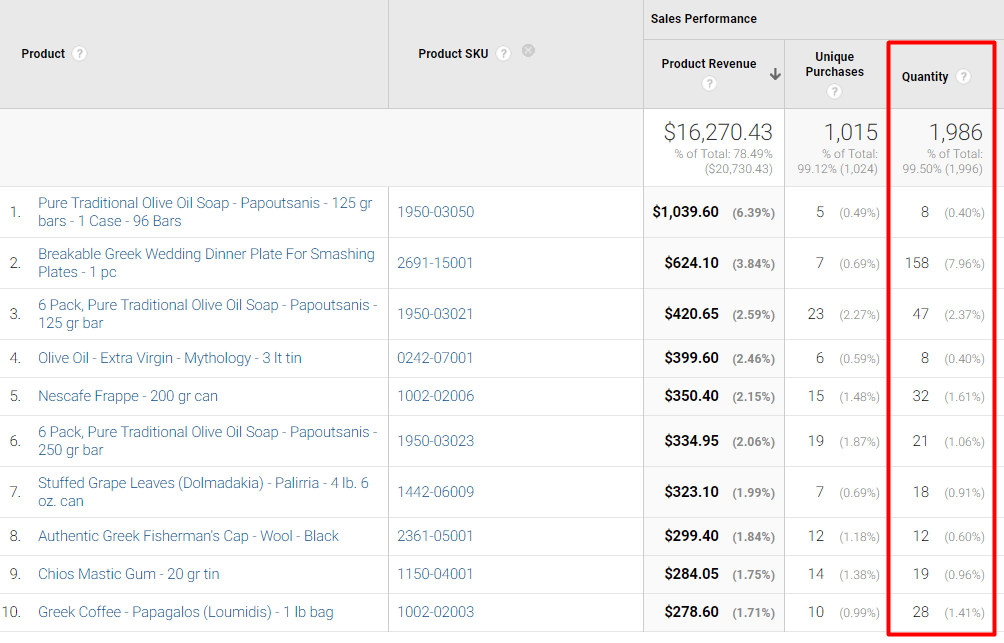
The “Quantity” column shows the number of units sold in the timeframe selected.
—
To forecast demand for an SKU:
- Click “advanced” above the table of data. Then set up an include filter to report on a specific SKU.
- Select an extended historical period, such as two years
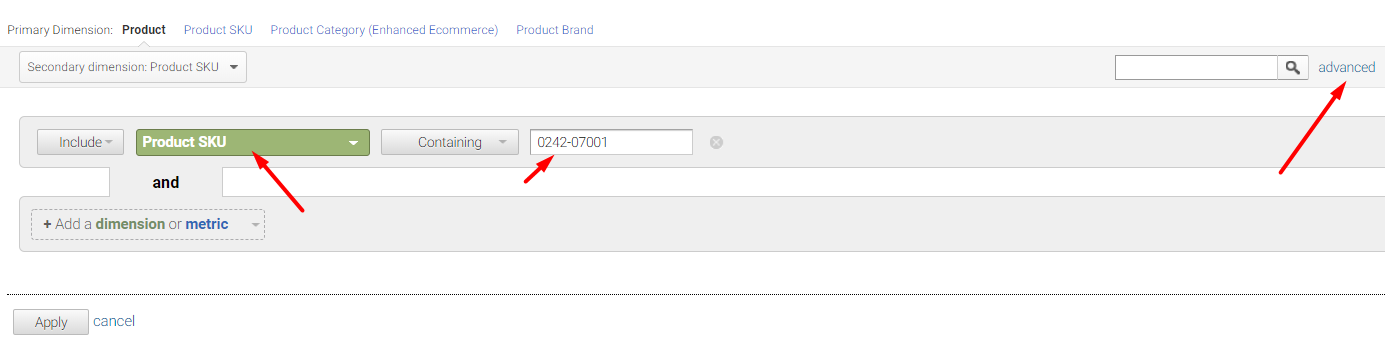
To forecast demand for an SKU, set a longer timeframe, such as two years.
The report will show two years of sales for a single SKU. In the example below, the SKU has multiple entries based on the sales channel – website, Amazon, eBay.
This SKU has several names due to sales on multiple channels.
—
To report quantity in the graph instead of revenue, select “Quantity” in the drop-down menu.

Select Quantity to include that metric in the graph instead of revenue.
—
Finally, report monthly data by changing options from “Day” to “Month.”
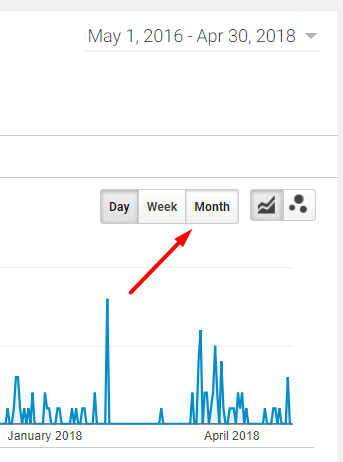
Use the Day, Week, or Month options for the desired timeframe.
—
The resulting output is two years of sales by quantity for the SKU. Use this data to understand seasonality impact on sales and to highlight overall trends.
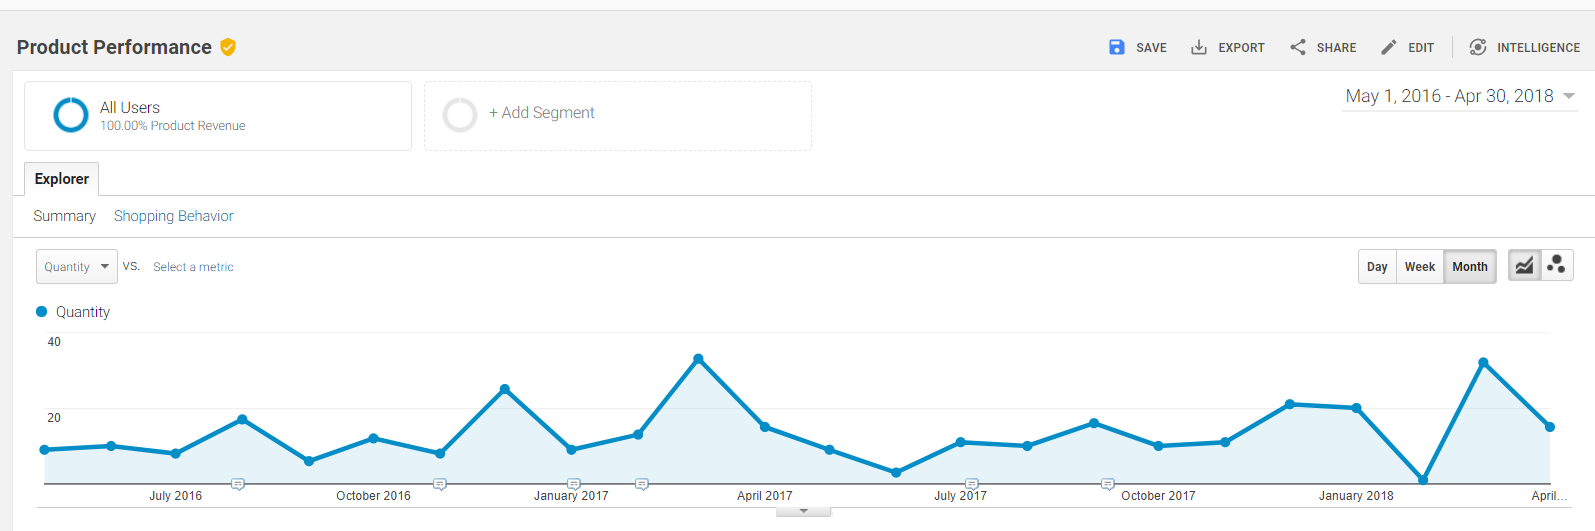
The output will be a 2-year sales trend, by quantity, for the chosen SKU.
Used jointly, the 2-year sales graph and the quantity sold table, below, can help you estimate future sales and inventory needs each month.
Use the quantity sold to estimate how much inventory to keep in stock.
—
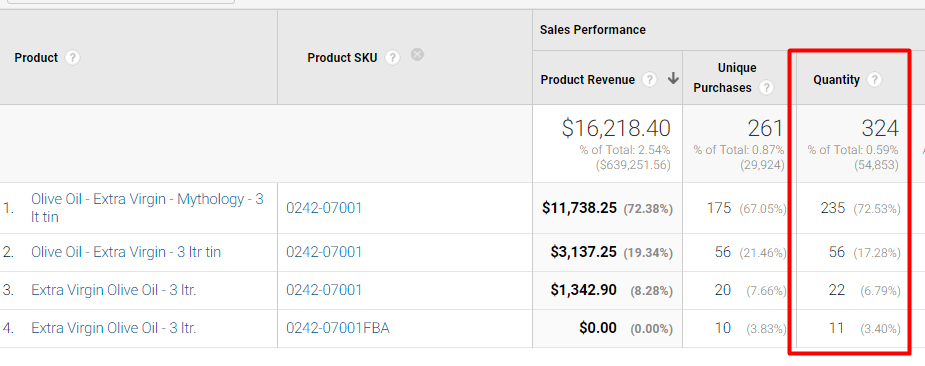
If the data is inconclusive, compare sales year-over-year. In the screenshot, below, I’ve selected the 12 months ended April 30, 2018, versus the same period ended April 30, 2017.
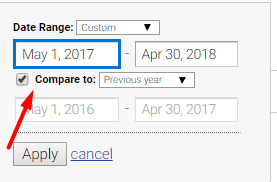
Compare year-over-year sales as necessary.
Then analyze the graph and table for changes in sales. In the example below, quantity sales of the SKU increased 10.5 percent. This indicates a higher demand, potentially, in the coming year.
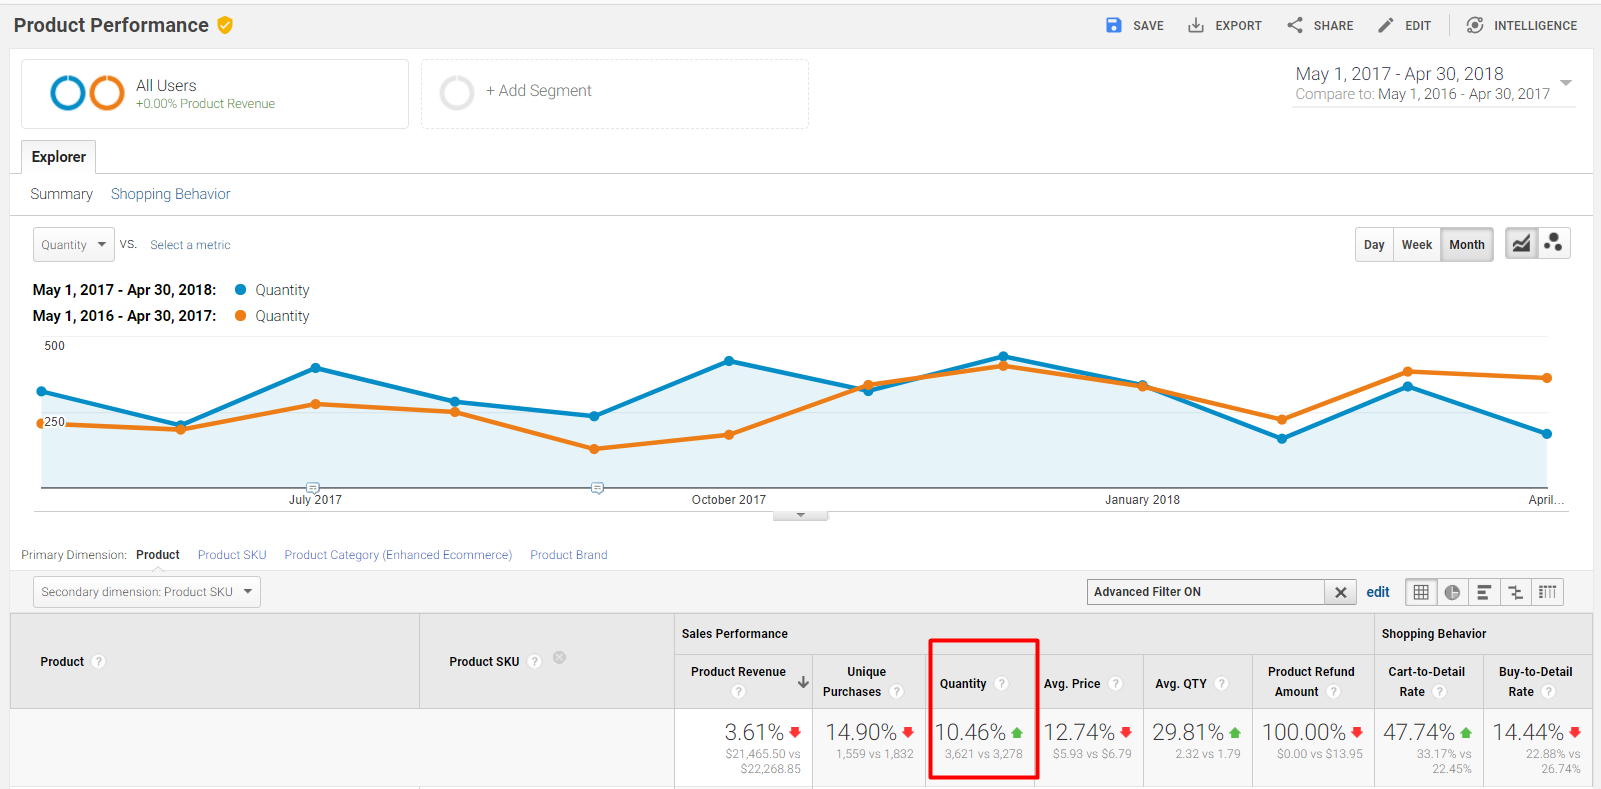
Quantity sales of the SKU increased 10.5 percent, indicating a higher demand, potentially, in the coming year.
Other Factors
When examining historical data, consider changes in pricing, advertising, promotion, and competitor actions that may not affect future sales. Report sales by product category — a dimension in Google Analytics — to observe changes over time. This may provide a bigger picture of inventory demand at the category level.
Combining Sales Channels
If a product is sold in multiple channels, such as on a merchant’s website, Amazon, and eBay, aggregating sales by SKU is more challenging.
In the event the sales cannot be aggregated in the shopping cart, Google Data Studio could be helpful. Data Studio’s “community connectors” reports sales by various channels. These connectors combined sales data from Google Analytics and a merchant’s shopping cart (if the cart has a connector) into one report in Data Studio to aggregate sales by a single SKU.
The sample Data Studio report below combines several sales channels for one product and compares year-over-year sales. I added a sample annotation for future planning — “Easter was 2 weeks earlier…”
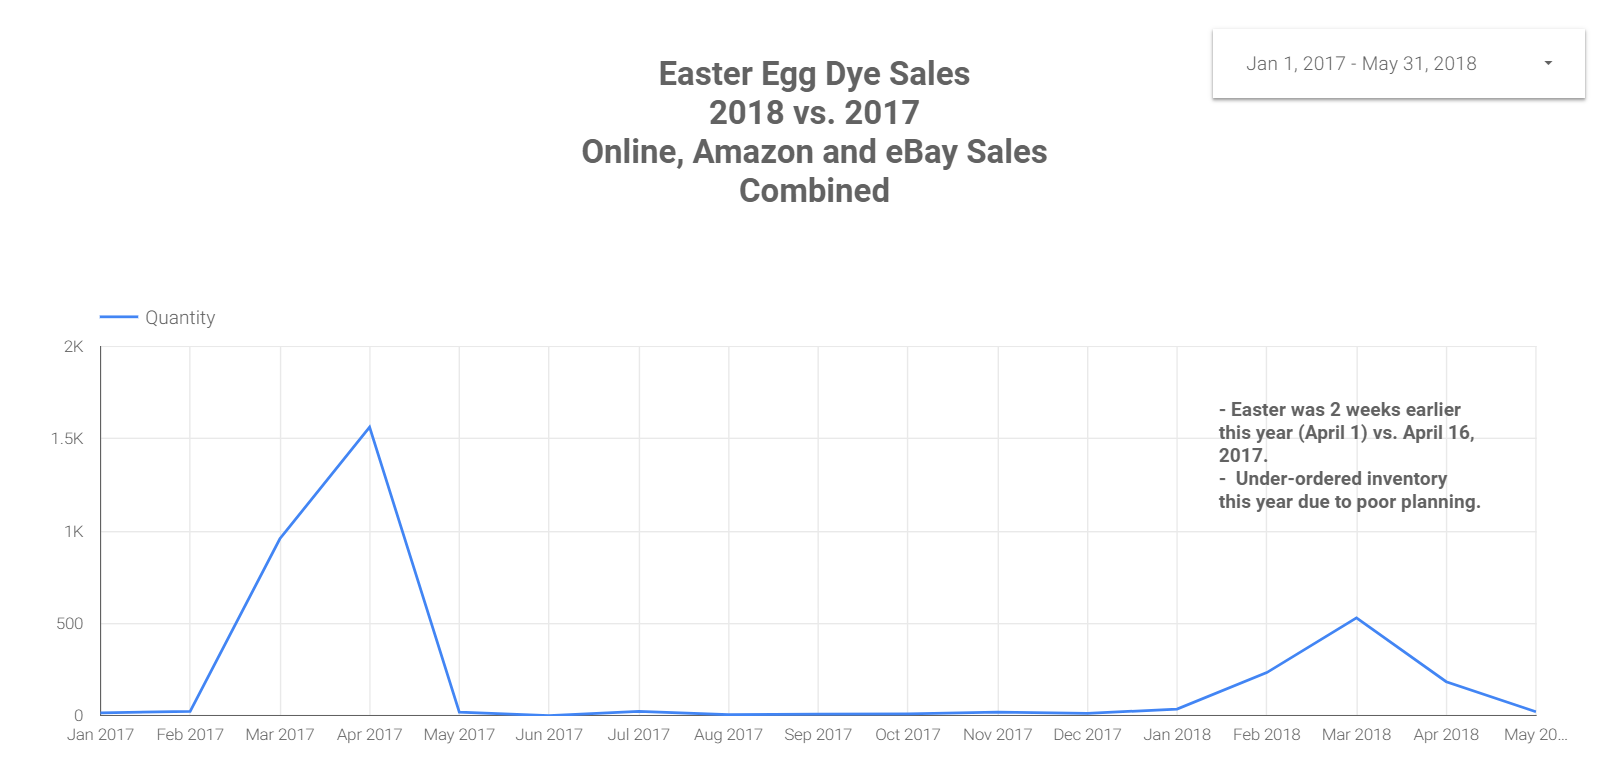
This Google Data Studio report combines sales channels for one product in a year-over-year comparison.