In “Using Google Analytics to Track Profitability by Product,” I explained how to import product cost into Google Analytics to calculate gross profit for each item sold. It was a tricky exercise. I received feedback and questions.
In this post. I’ll break the process down by using Google Data Studio and data blending.
Gross Profit by SKU
To set up reporting for the cost of goods sold, create a Google Sheet that lists SKUs and their cost. Create two columns:
- Product SKU
- Wholesale cost of each product.
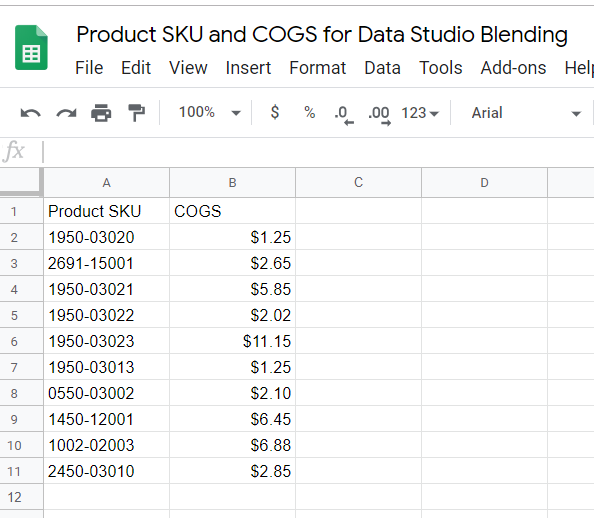
Create a Google Sheet that lists SKUs and their wholesale cost.
Next, blend this data with sales info from Google Analytics.
- Create a Data Studio report and add your Google Analytics account as a data source. (For more, see my Google Data Studio article and this post from Google for Data Studio help)
- Add the Google Sheet with the two columns for “Product SKU” and “COGS” as a data source to your Data Studio report
- Create a table in Data Studio by clicking “Add a chart,” then selecting a Table chart
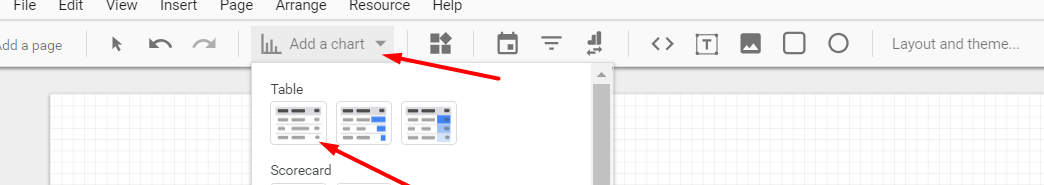
Create a table in Data Studio by clicking “Add a chart.” Click image to enlarge.
- Blend the two data sources for this chart by clicking “BLEND DATA” under the Data Source section for the chart. (This article on data blending from Google is worth reading before getting started.)
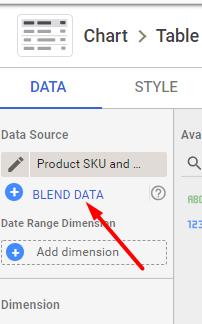
Blend data sources by clicking “BLEND DATA.”
- In the example below, the Google Analytics account for www.greekmarket.com is the first data source.
- The Google Sheet with COGS data is the second data source.
- The “Join key” is “Product SKU” from each data source.
- Report “Quantity,” “Product Revenue,” and “Avg. Price” from the Google Analytics data source.
- Report “COGS” from the Google Sheet data source.
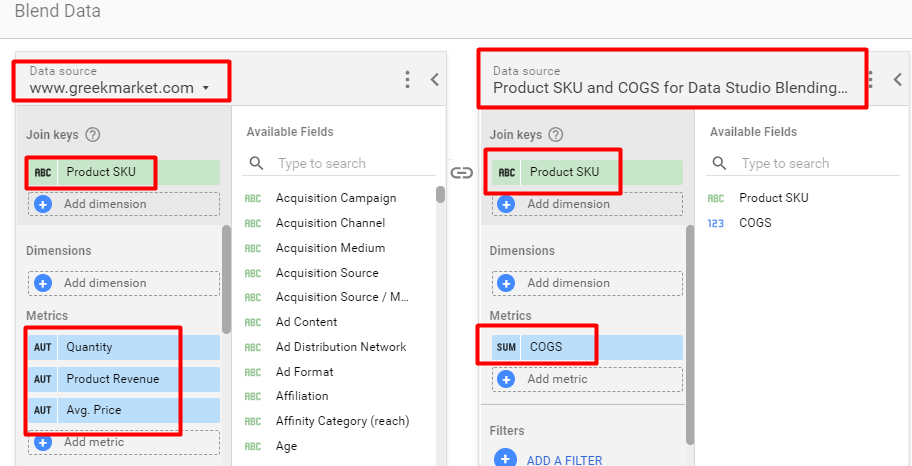
After data is added, save and close the blending data source. Click image to enlarge.
Save and close the blending data source then add two more metrics. To do this, click the “Add Metric” link under the list of available metrics.
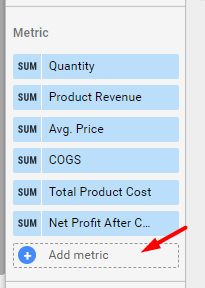
Add two more metrics.
The first metric is “Total Product Cost.” The formula is COGS * Quantity.
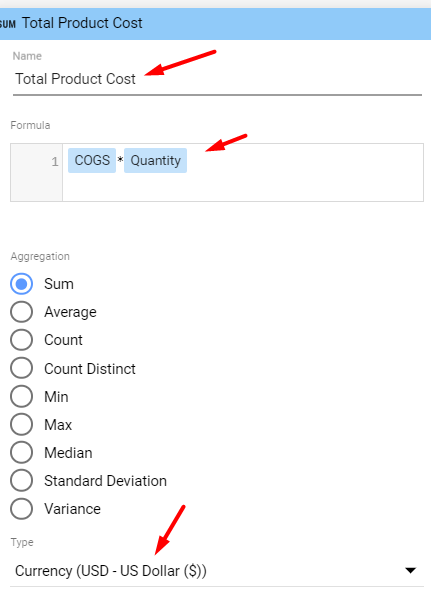
Add the total product cost metric using the formula COGS*Quantity. Click image to enlarge.
The second metric is “Net Profit After COGS.” The formula is Product Revenue – (COGS*Quantity).
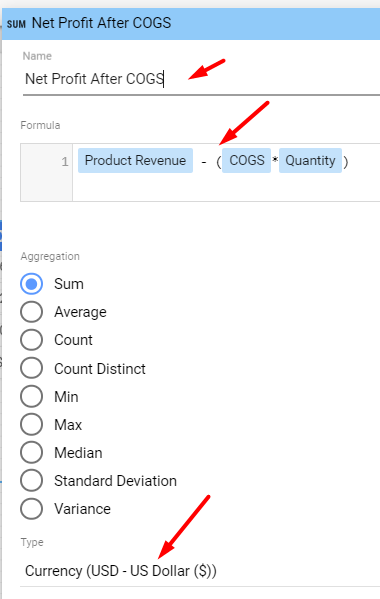
Add the “Net Profit After COGS” metric using the formula Product Revenue – (COGS*Quantity). Click image to enlarge.
The final list of metrics should look like the following, with the two calculated metrics added.
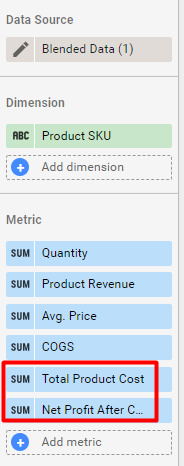
The final list with the calculated metrics added.
Your chart should look like the following with the “Net Profit After COGS” column reporting the key metric you want: the cash flow from sales minus cost of goods sold.

Additional metrics can be derived from the data, such as return on investment after COGS: (Product Revenue – (COGS*Quantity))/(COGS*Quantity). Click image to enlarge.
Keep in mind this is a simplified report. It does not consider the following.
- Product costs changing over time. An additional column could be added to the Google Sheet that shows the date for each product cost.
- Coupons applied to orders. A calculated field that adjusts “Product Revenue” could be created. It could use an estimate of the net revenue, minus coupons, at the product level.
- Cost of shipping expenses not passed on to the customer. An estimate of the revenue loss to cover shipping expenses could be applied to an adjusted “Product Revenue” metric.
- Advertising cost for each SKU.
Driving Cash Flow
Use the process in this post to establish the optimal price to drive the most cash flow after product cost. It can also help establish advertising cost by product category.