In “Using Server Logs to Uncover SEO Problems,” I explained that web server logs can be helpful, but the data is raw and requires transformation and analysis. In this post, I’ll explain how to analyze raw data with business intelligence visualization tools.
I usually perform analyses in Tableau Software, a data visualization platform. But Google released a powerful competitor last year in Data Studio, which is free and cloud-based. Data Studio can assist with the analysis of large datasets by guessing the relevant metrics and dimensions of “visualization containers,” such as pie charts. In Tableau, you need to assign metrics, and then select the most appropriate visualization.
Visualization in Action
Here’s an example of using an advanced backlink analysis to answer some challenging questions.
Back in 2013 I was referred to a client that had an unusual request. Most clients want to know how they can increase or recover their traffic from organic search. This client, however, was asking for help figuring out why its search traffic was doing so well.
The company launched a site that went — in less than a year — from zero to half a million visits per month. The staff didn’t know why this was happening. But they wanted to understand it, and focus on whatever was working so well. At first, I assumed they were using black-hat SEO tactics. But my analysis proved the opposite.
The chart below is my analysis on Tableau, to determine if links to the site were driving the massive increase in traffic. The Y-axis, on the left, tracks “Visits,” “New Visitors,” “Number of Domains,” and “Number of Links.” The X-axis, on the bottom, shows the month for each of those metrics.
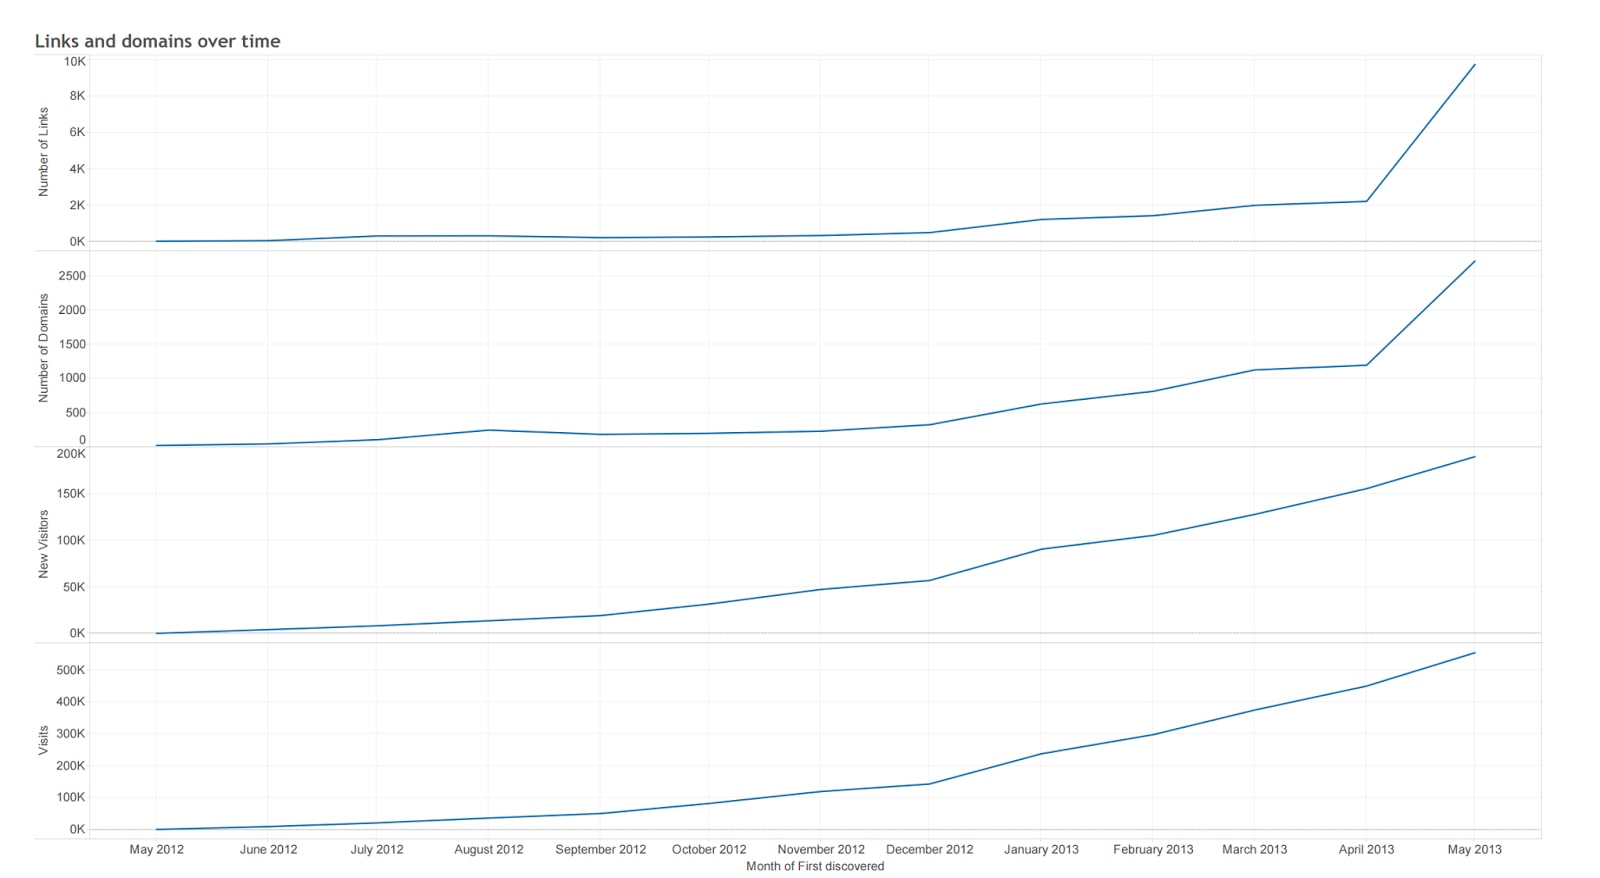
In this example, a site went from zero to half a million visits in less than a year.
There is a strong correlation between “Number of Links” (at the top) and “Visits.” After seeing the massive influx of links from many different sites, I was suspicious that the links might have been purchased. The company had recently launched an affiliate program and I wondered if Google viewed, incorrectly, the affiliate links as organic. Google ordinarily considers affiliate links incentivized and doesn’t factor them into a site’s rankings.
When I analyzed the links to their site — comparing affiliate links versus non-affiliate — it appeared that my suspicions were correct: 56.22 percent were from affiliates and 43.78 percent from non-affiliates.
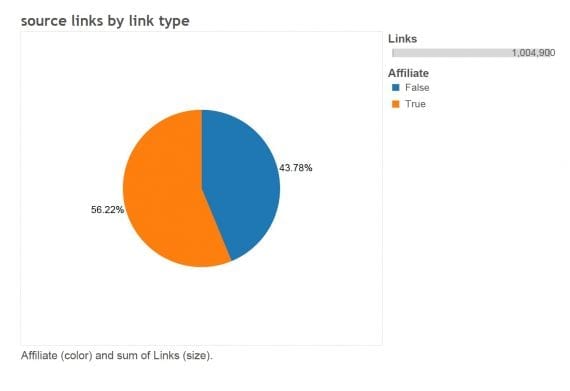
In reviewing overall links to the site, 56.22 percent were from affiliates and 43.78 percent from non-affiliates.
However, when I reviewed only the percent of unique sites, I saw that 91.75 percent were from non-affiliates. Only 8.25 percent of linking domains were from affiliates.
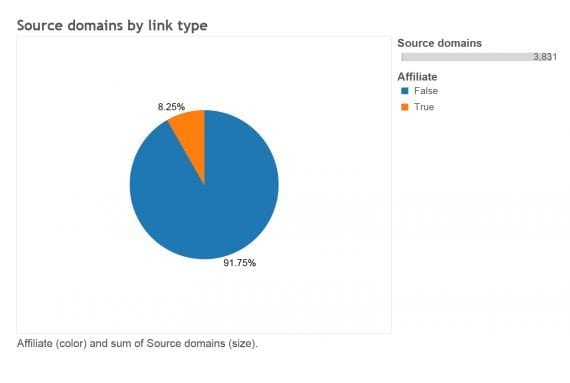
Only 8.25 percent of sites were using affiliate links.
The affiliate program launched about a month or so before I ran these reports. So it made sense that the affiliate links were not the reason for the client’s growth.
One key element of traffic was a helpful community that the client courted early on. The client’s target market was relatively narrow compared to similar companies. The client hired full-time writers to produce detailed, helpful tutorials that were not focused on selling, but, instead, addressed relevant problems — for free.
The client implemented this strategy not because it was looking for organic search traffic. Rather, the client’s goal was to help its target community. Visitors loved the content so much that they told others, and the organic growth engine kicked in.
Continuing the analysis, I reviewed the impact this community had in terms of attracting links to the site. I looked at the percentage of total links to the site’s community pages, which contained the tutorials. Only 2.34 percent of total links were directed at those pages.
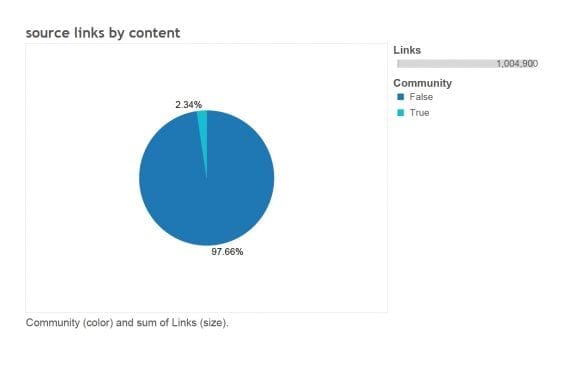
Just 2.34 percent of total links were directed towards the site’s community pages.
However, 48.11 percent of unique sites linked to the community pages. Bingo! The community pages attracted almost half of the links from unique sites. This was due, presumably, to the high quality articles and tutorials, and to the client’s strong influencer outreach program.
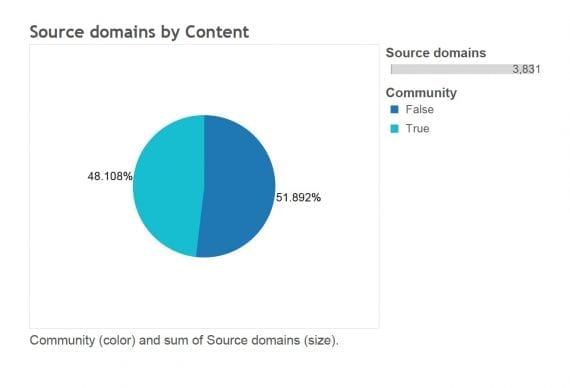
At 48.108 percent, the number of unique sites linking to the site’s community pages was high.
Thus, using the data visualization tools, we were able to help the client understand the cause of its organic search traffic.
Using Google Data Studio
Now, let’s reproduce this type of analysis in the new Google Data Studio tool.
In the example of my client, we were primarily conducting a backlink analysis. We needed to get the best possible link data to arrive at accurate conclusions.
While there are a number of high quality backlink reporting tools, for this type of analysis I prefer to get the data directly from Google Search Console. This way, we can see the date Google discovered the links and how link strategies progressed over time from Google’s point of view.
To view inbound links in Search Console, go to Search Traffic > Links to Your Site. Under “Who links the most,” click “More.”
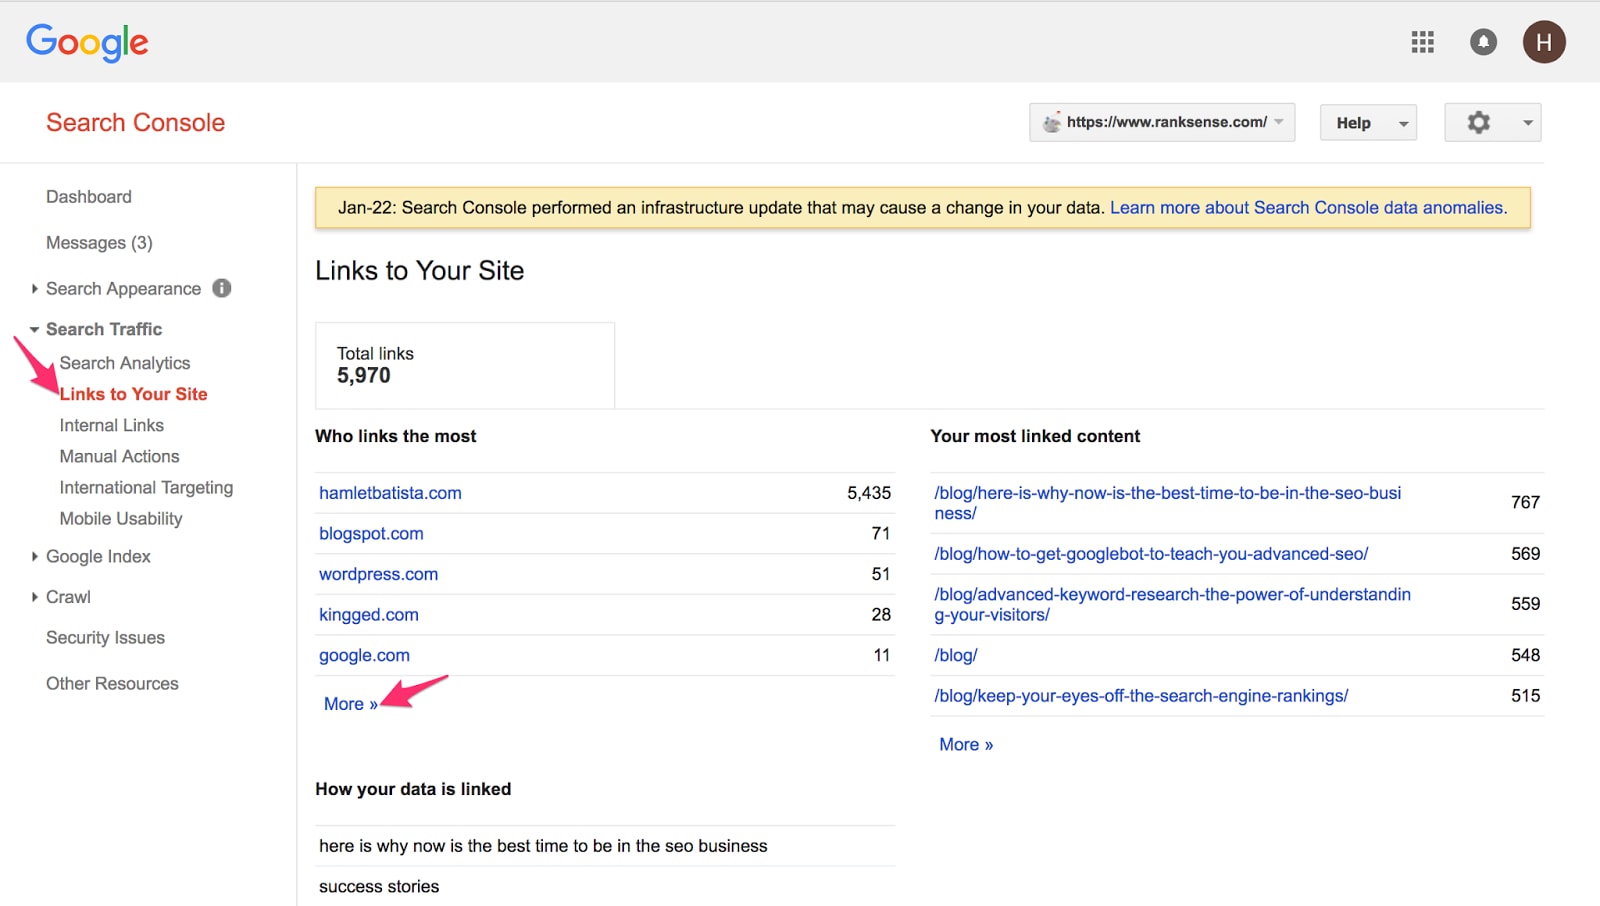
To view inbound links in Search Console, go to Search Traffic > Links to Your Site. Under “Who links the most,” click “More.”
Then choose “Download latest links“ on the next page.
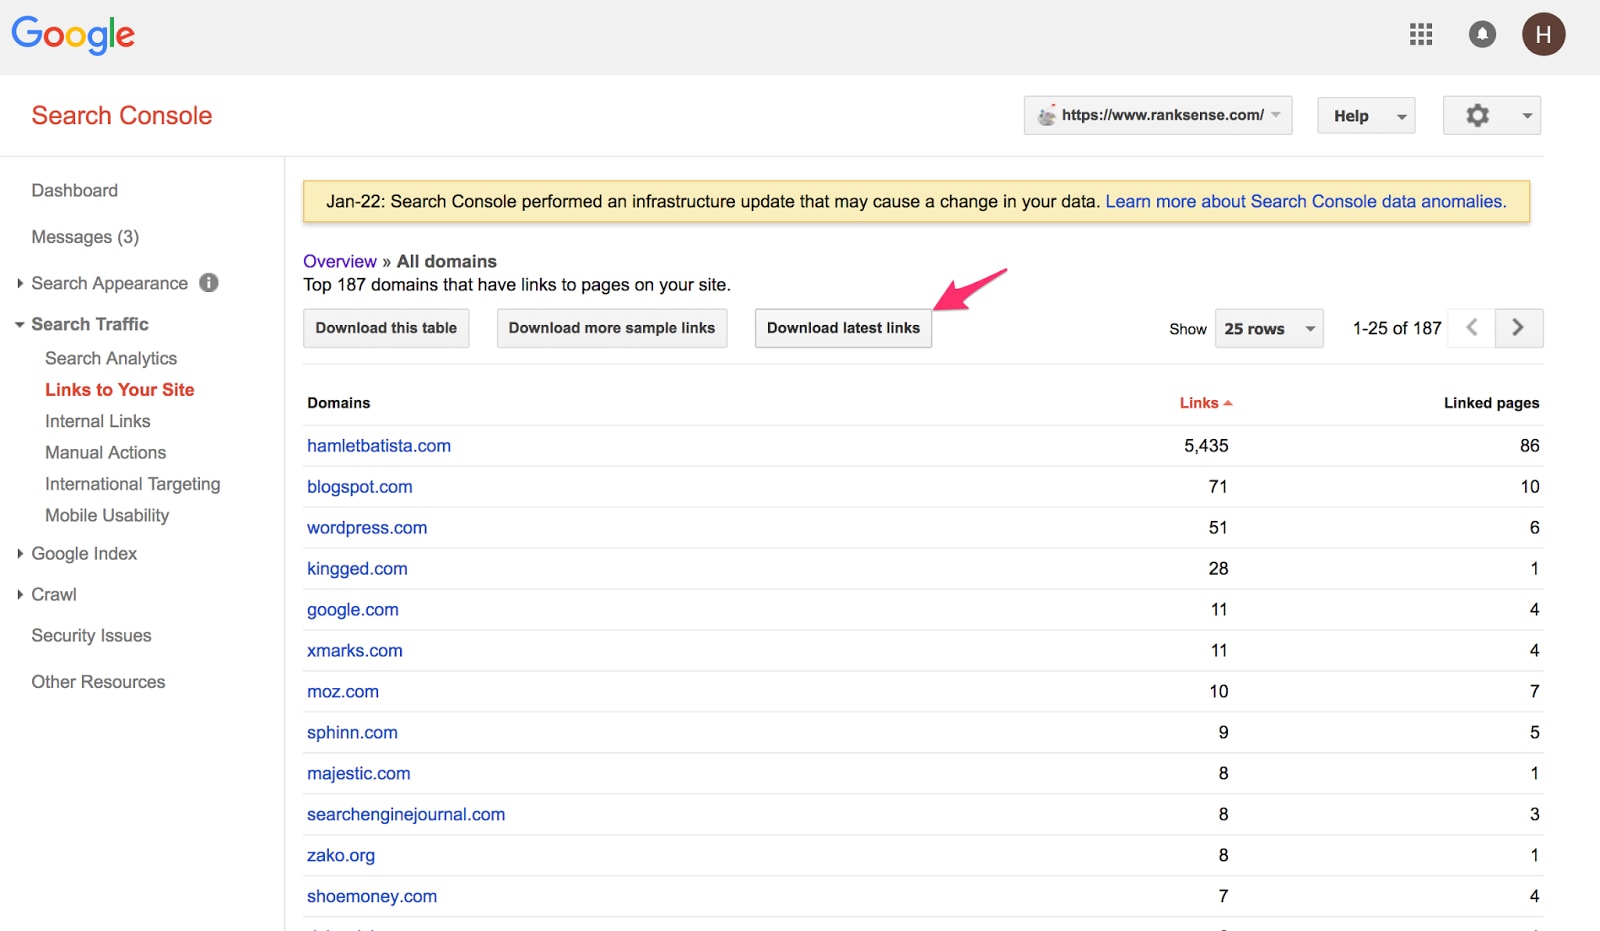
Click “Download latest links.”
Then choose the CSV file option. You will receive a file with two columns: “Links” and “First Discovered.”
For this analysis, I need the number unique linking domains. The CSV file doesn’t readily include that information, but I can create it as a new field in Google Data Studio.
First we need to create a dataset by uploading the CSV file using the “File Upload” option in Data Studio. This will place it into Google Cloud Storage. (As an aside, if you upload CSV files or raw data to Data Studio frequently, it’s helpful to import the files directly into Google BigQuery and use BigQuery as a data source. It is especially useful when dealing with large datasets. This tutorial explains how to load CSV files to BigQuery.)
After we’ve uploaded the CSV file, we click on “Create New Data Source” in Google Data Studio and select the “File Upload” option. This will prompt Google Data Studio to access Google Cloud Storage.
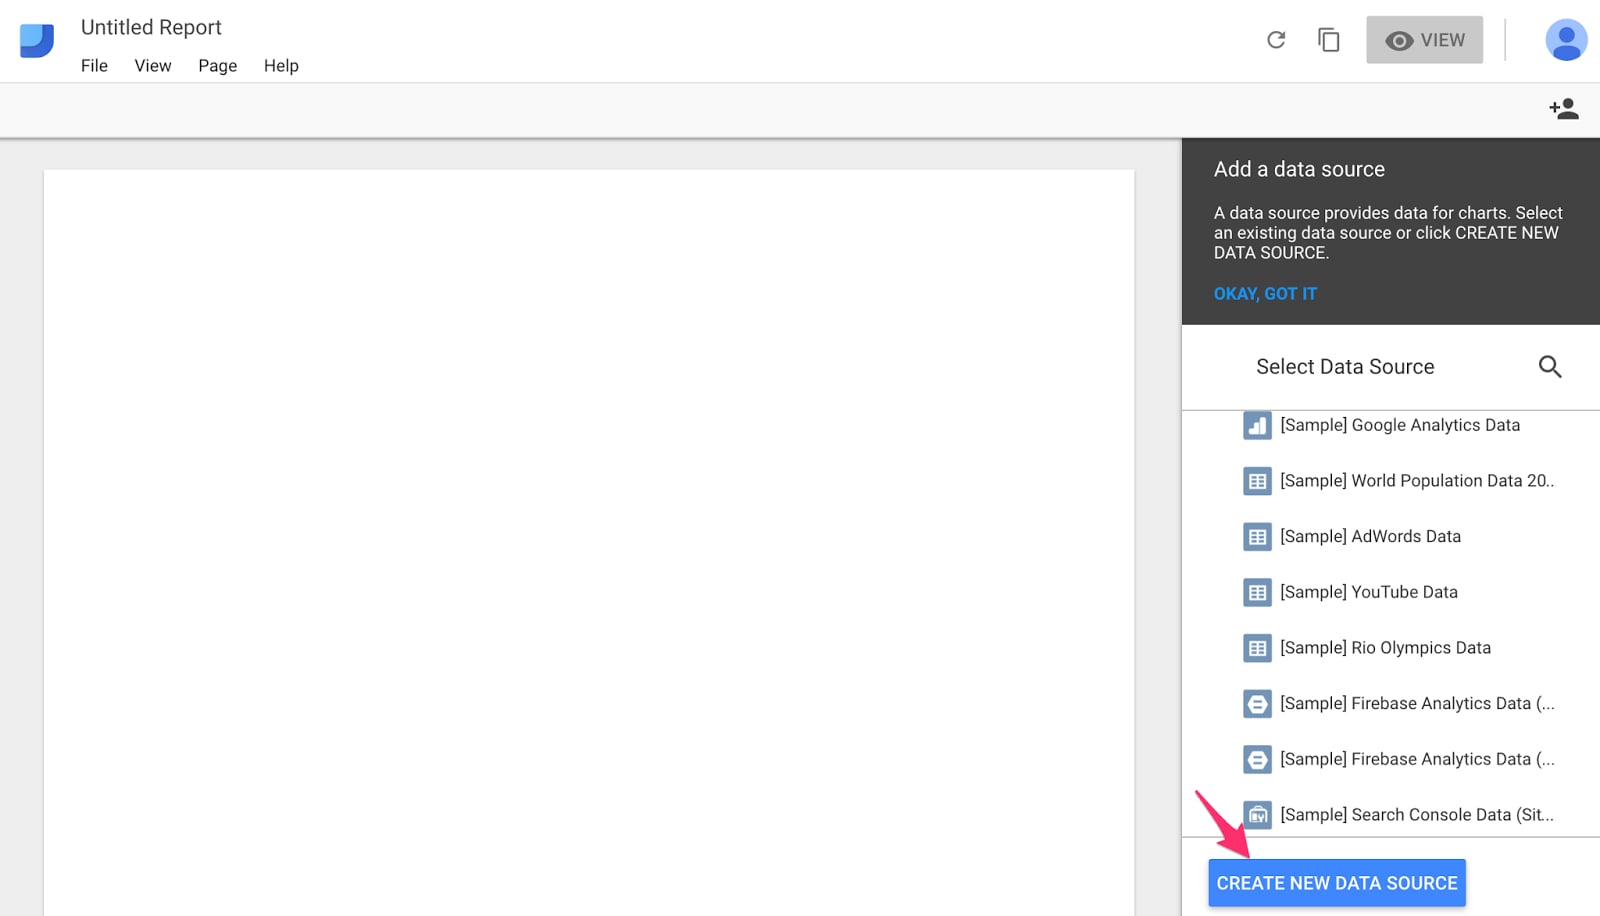
After uploading the CSV file, click on “Create New Data Source” in Google Data Studio and select the “File Upload” option.
Then we can simply drag and drop the CSV file.
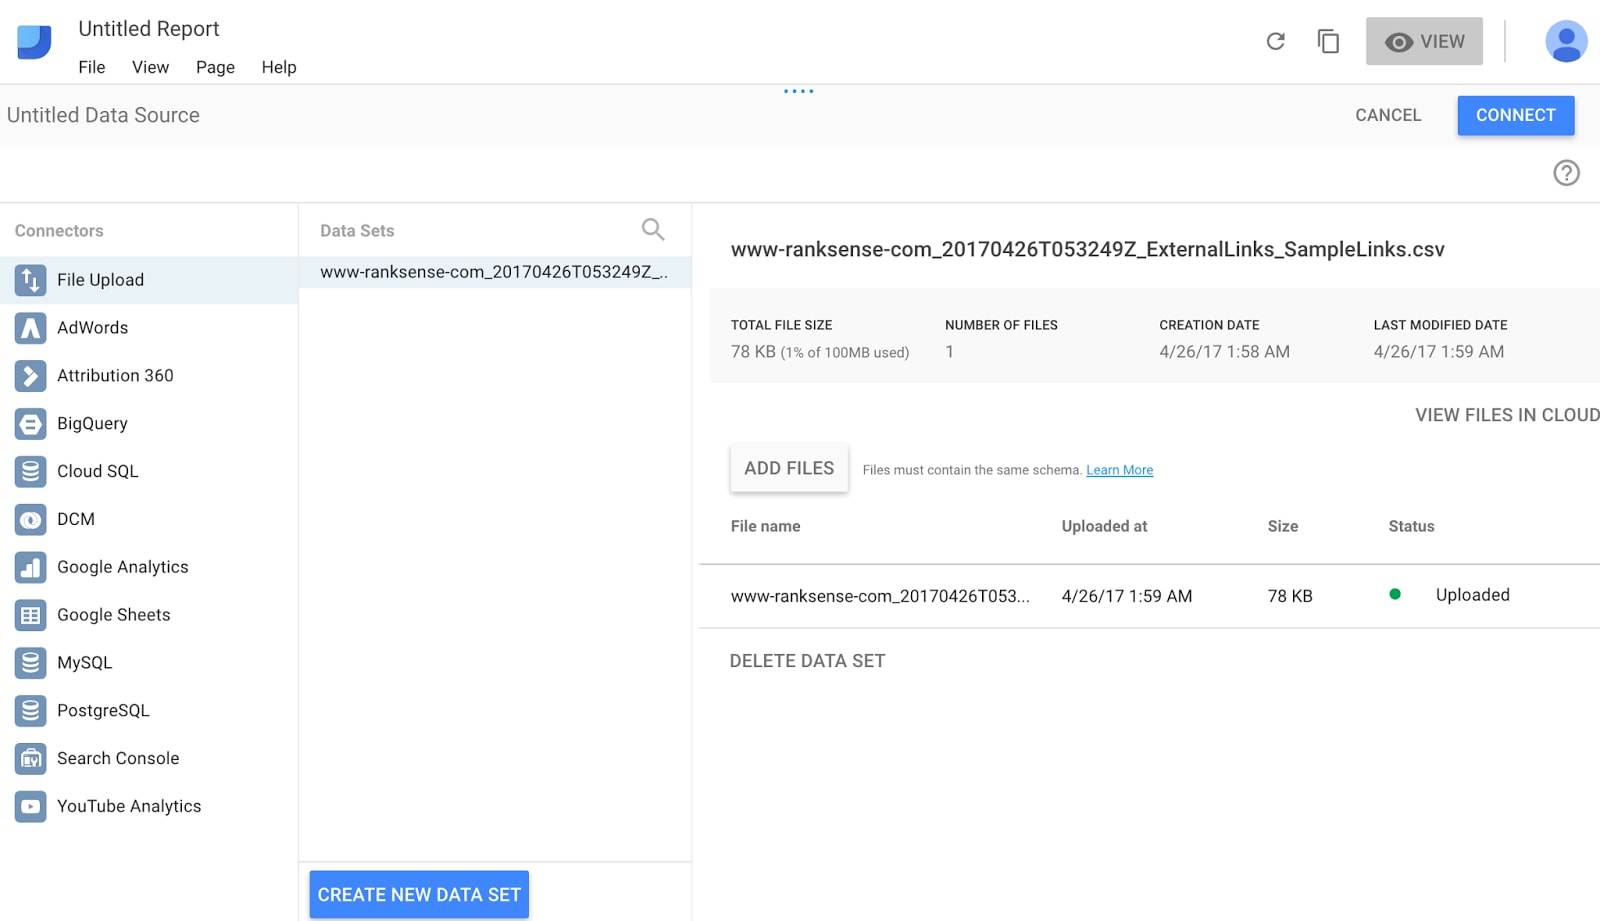
Select the “File Upload” option and upload the CSV file.
Clicking “Connect” (shown above), we see the fields in the CSV file, including their data types.
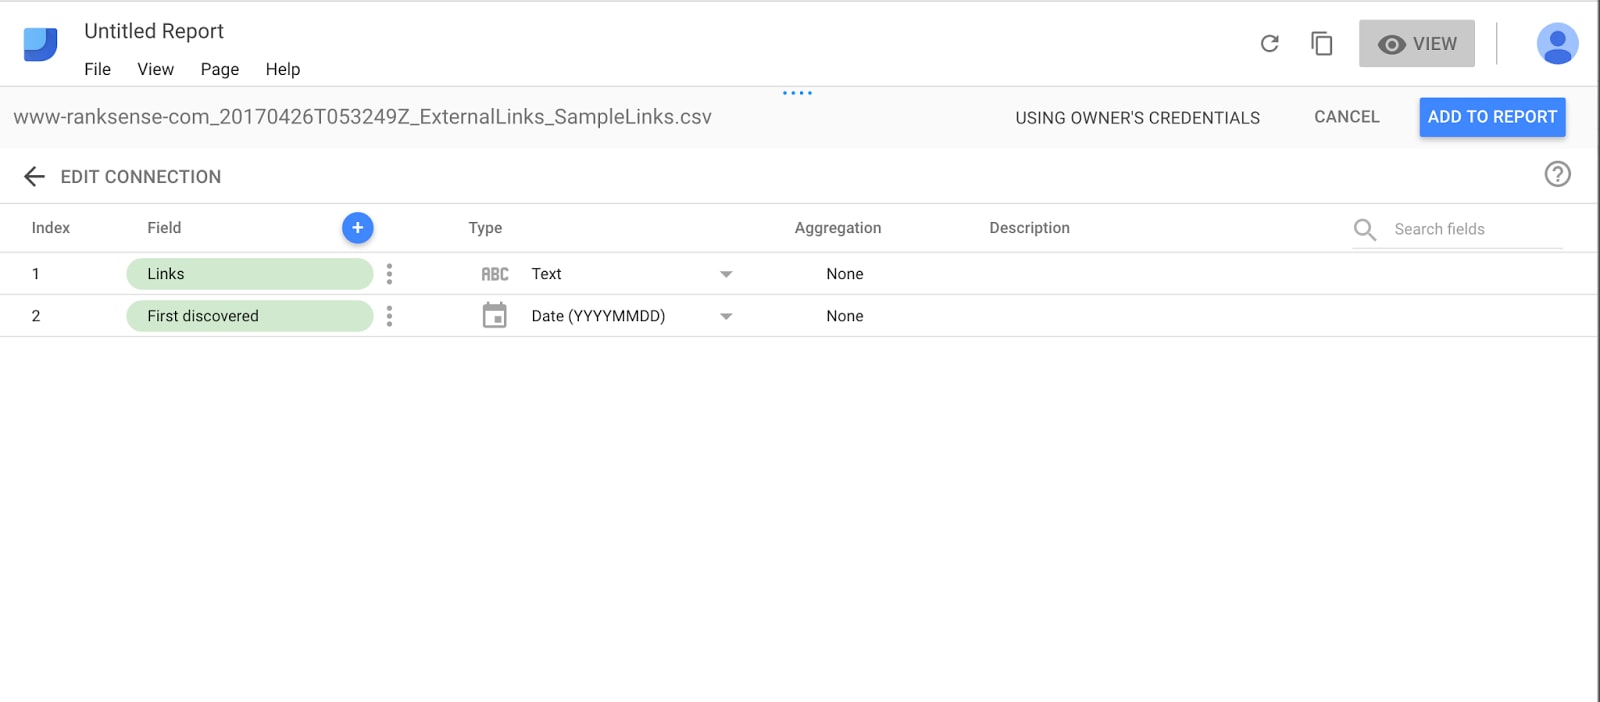
Click “Connect” to see the detected fields.
Data Studio provides a canvas to design reports. To do this, go back to the report, select the line chart, and then drag to the canvas. Adjust the size as desired.
Recall that our goal is to calculate the number on unique linking domains. In this case, Data Studio cannot plot a chart because the CSV file contains no numerical fields — only a text field and a date field.
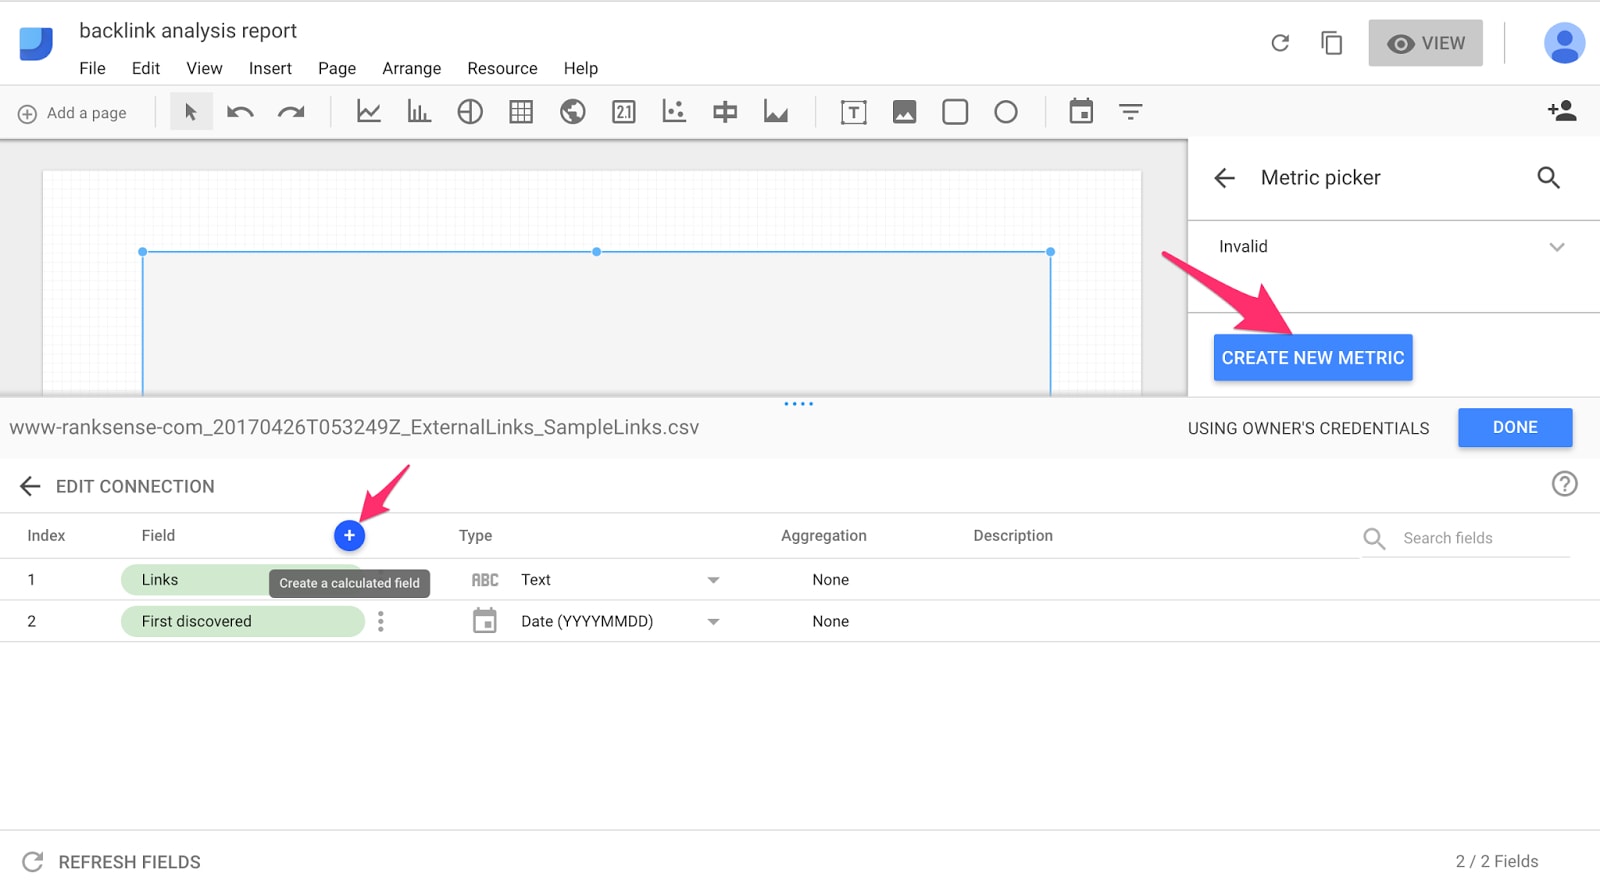
Create a new metric to count the number of unique links.
To fix this, we will create a metric to count the number of unique links by clicking “Create Field,” then naming the field — we’ll use “links_count.” In the formula, I’ll enter COUNT_DISTINCT and select “Links.”
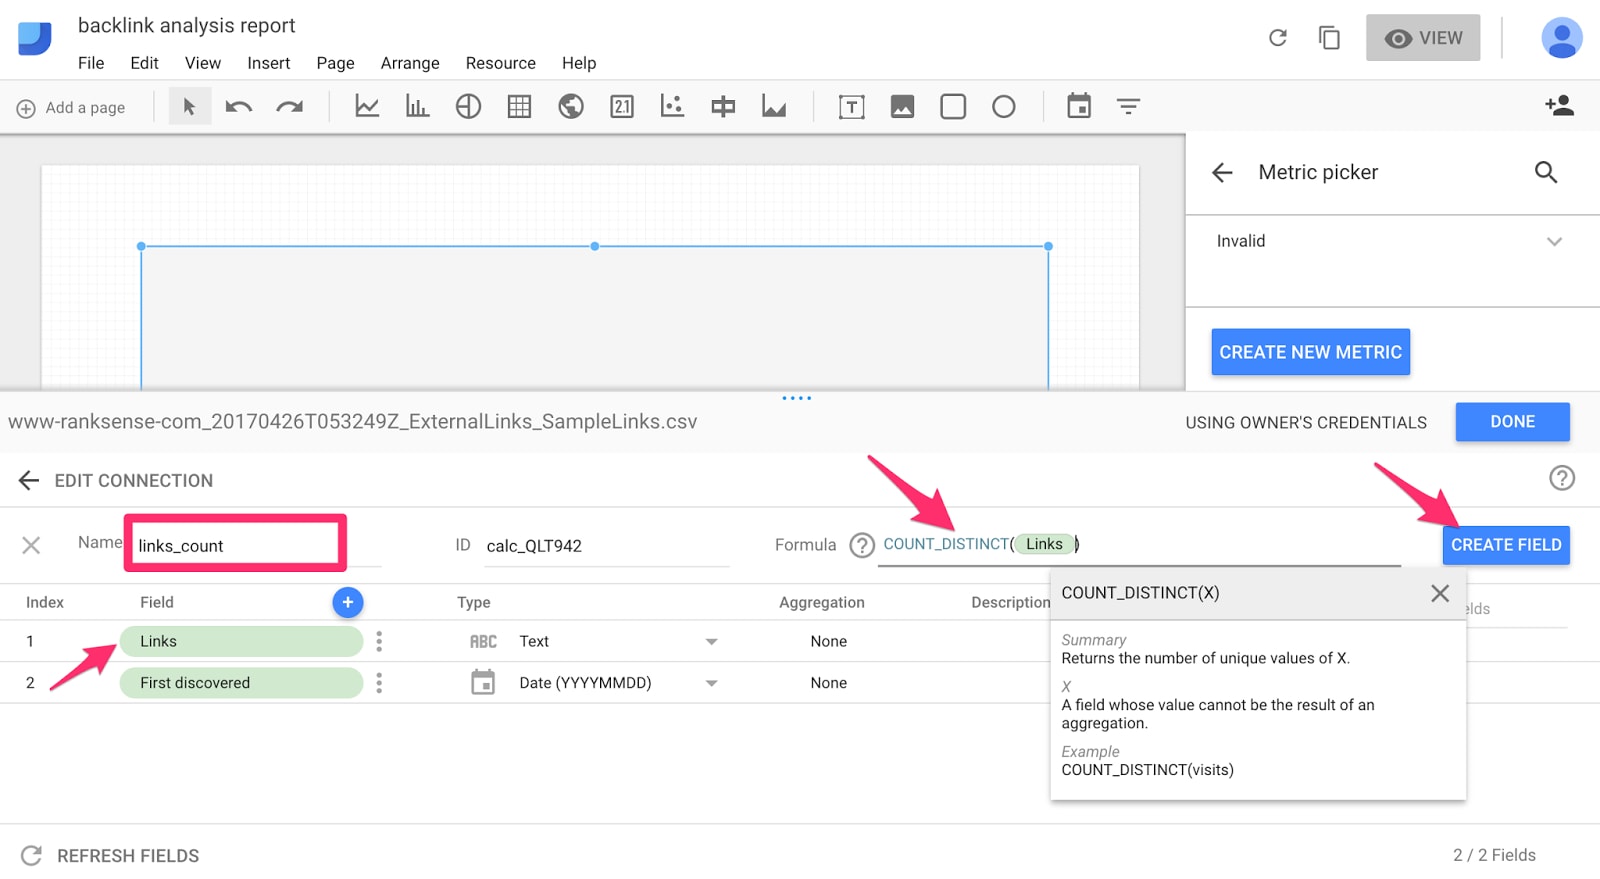
Click “Create Field,” then name the field links_count. In the formula, enter COUNT_DISTINCT and select “Links.”
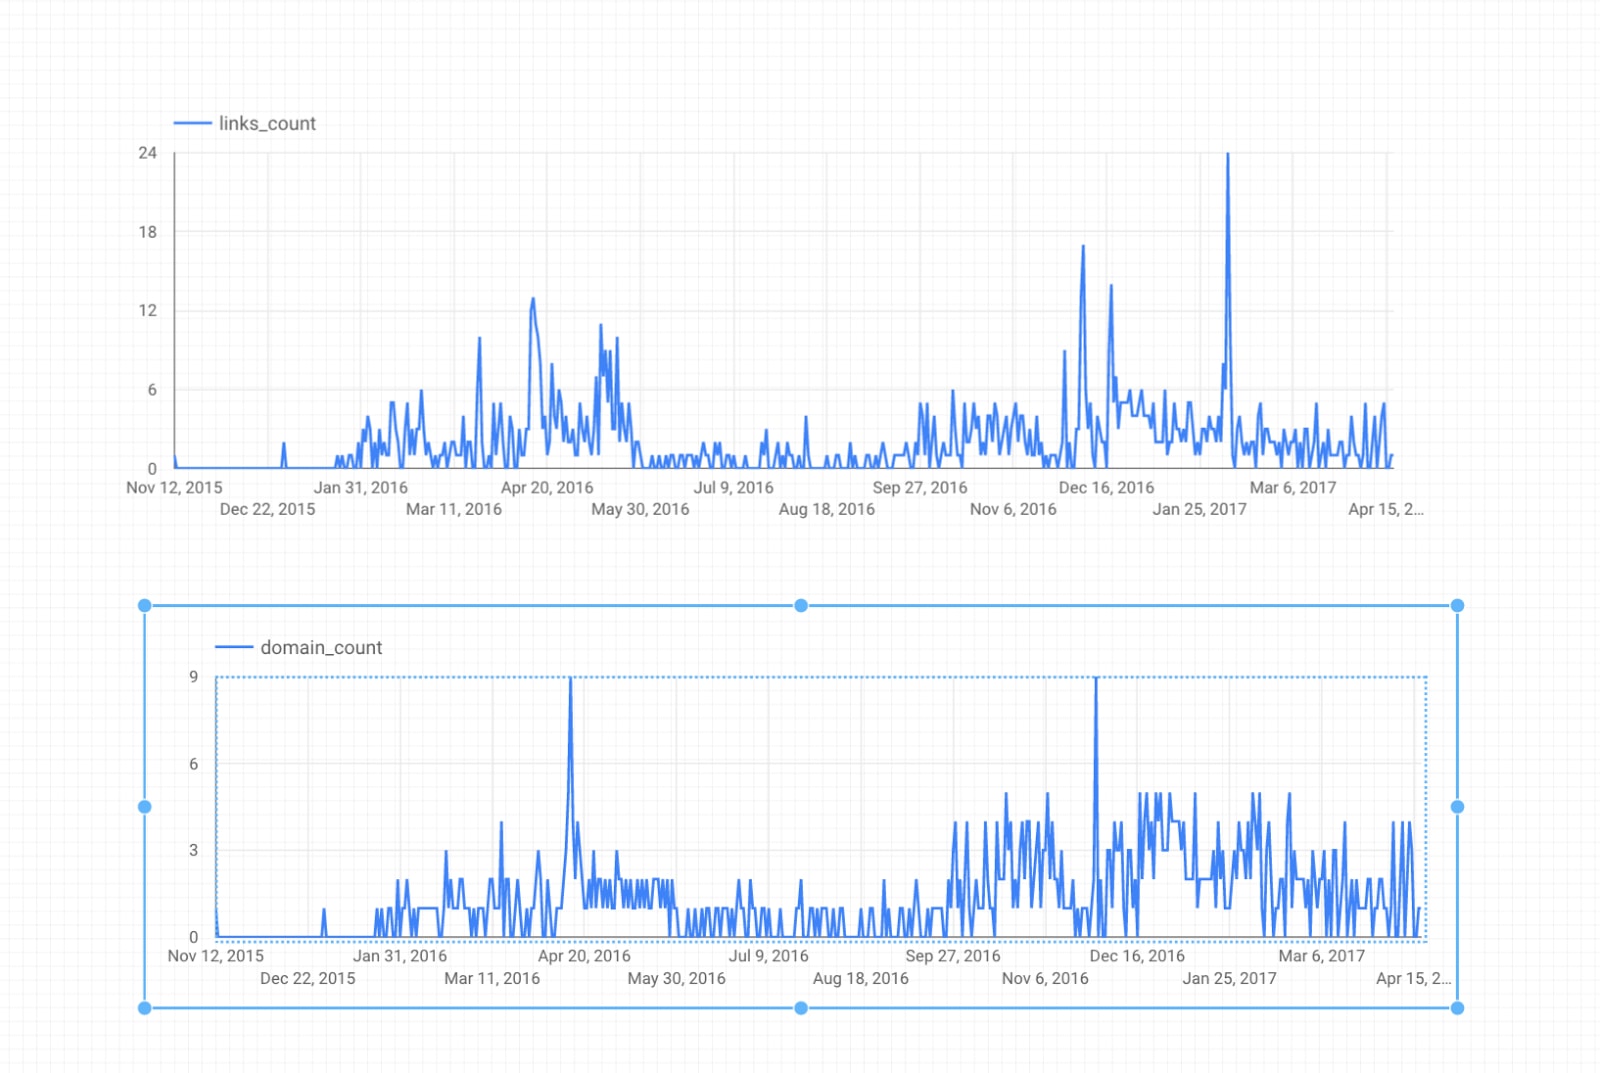
After we create the new metric and select “links_count” as the metric to plot, Data Studio produces a graph of the growth of links over time to the site.
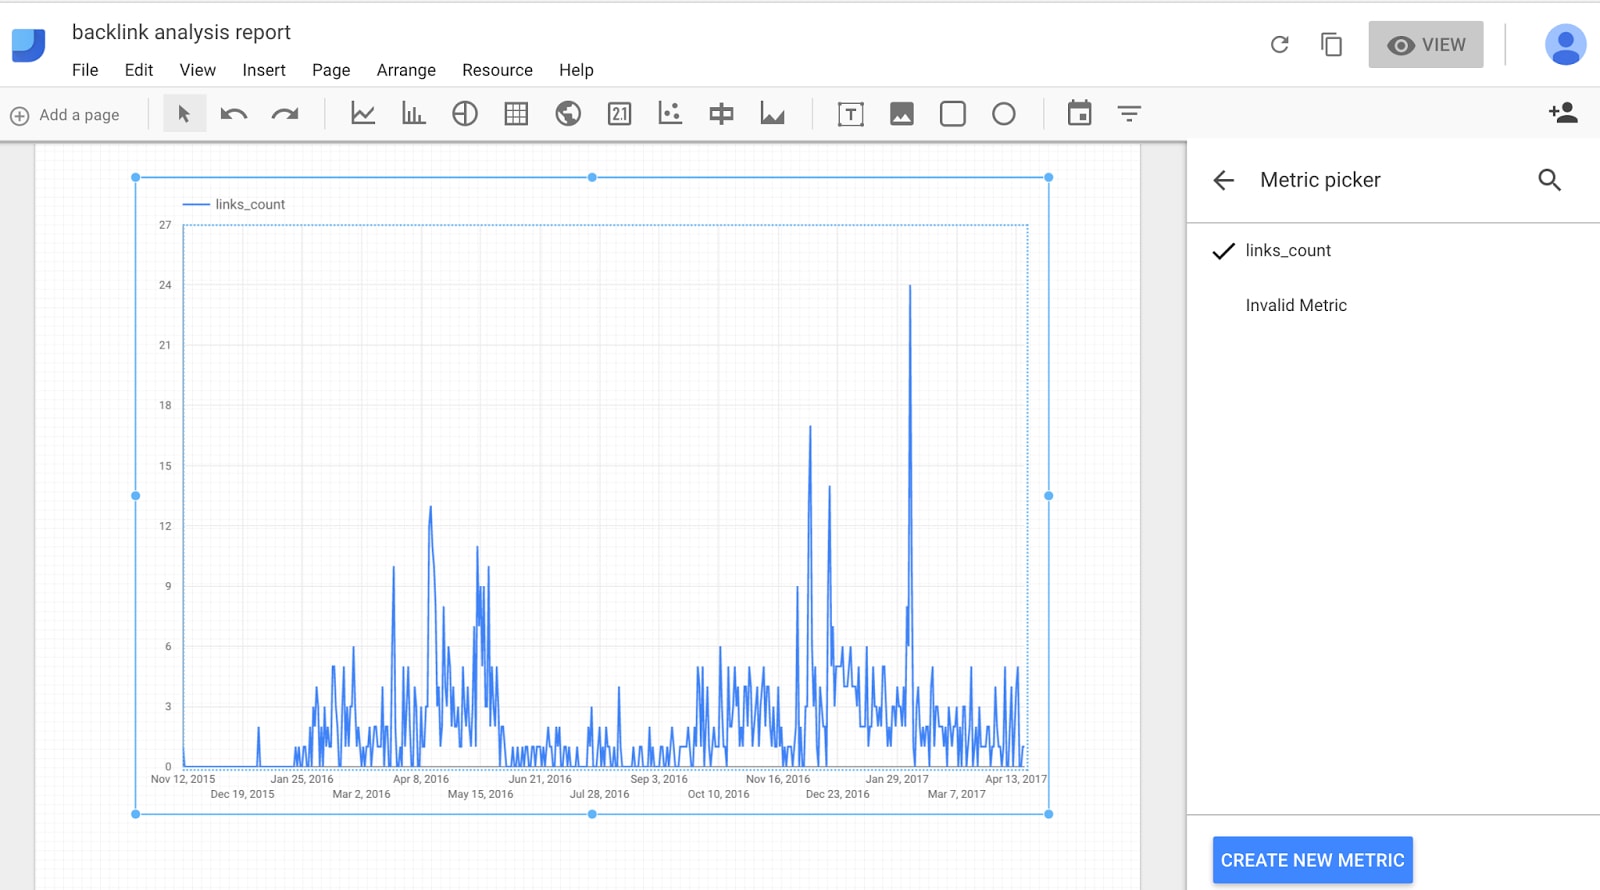
A plot of the growth of links over time to a site.
Now we have a valuable Data Studio report showing insights beyond what appears in Google Search Console, even though the data originated from there. We can use this report often when reviewing profiles for bad links. It makes it easy to spot unexpected jumps in the number of links.
Next, let’s plot the number of unique domains instead of links. Links from unique domains are generally far more valuable than links coming from the same domain. The plot will be similar, but instead of counting individual links, it will count unique linking sites.
Since we don’t have a field for the domain of the links, we’ll create a new field that will use a regular expression to extract the domain name. I introduced the concept of regular expressions in the aforementioned server logs article.
To me, seeing the visual representation of the values from regular expressions is helpful as a test, to ensure it is correct. The simplest way I found to do that in Google Data Studio is to add a table visualization with the calculated field as a column.
To do this, first create a new dimension that will calculate the domain out of the links. Click on “Dimension picker” and choose “Create New Dimension.”
Here is the regular expression I used to create the domain field.
REGEXP_EXTRACT(Links, '^https?://([^/]+)/[^ ]+/?')
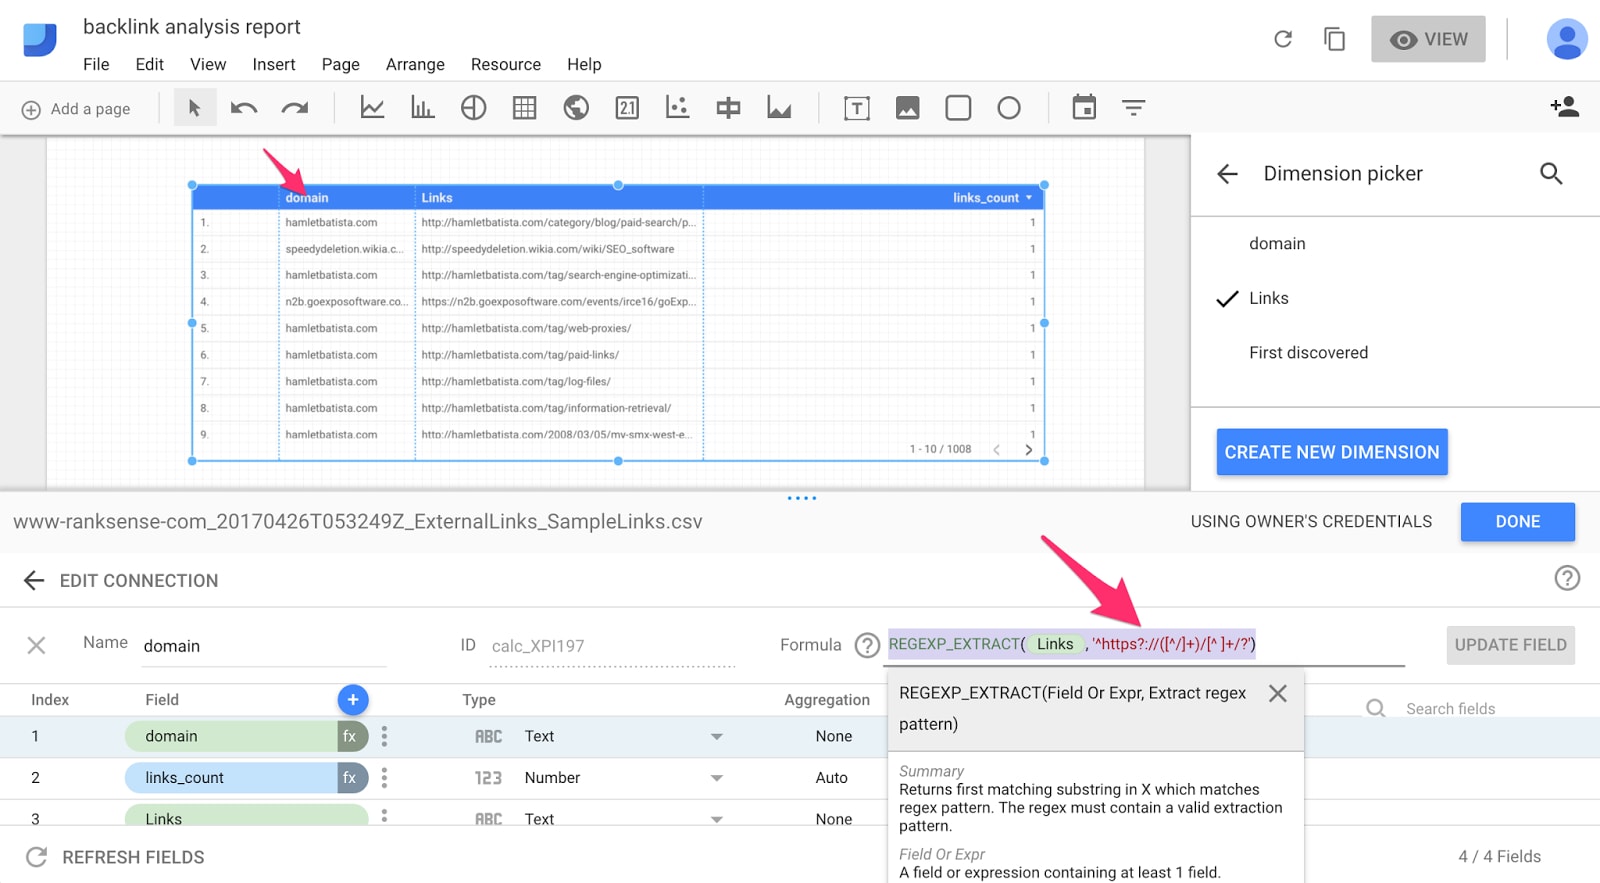
Create a new dimension and enter the regular expression.
The table extracts the domain correctly. Next, we want to create a new metric to calculate the domain counts for our graph. We’ll again use COUNT_DISTINCT in the formula, but this time, we’ll select “domain” to get a count of the distinct domains.
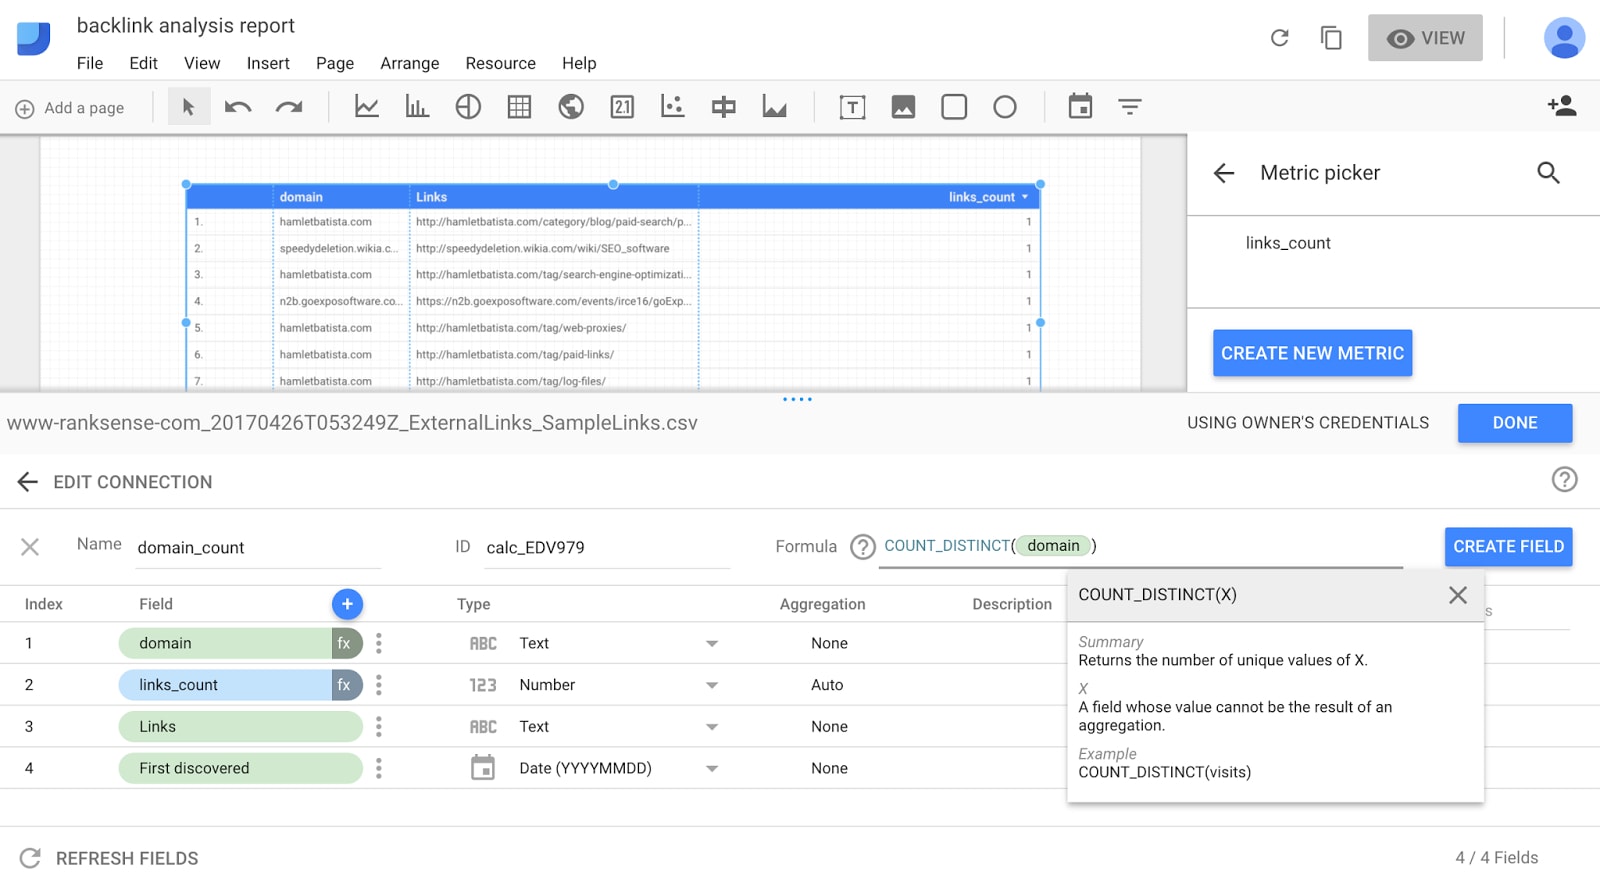
Select COUNT_DISTINCT in the formula and then select “domain” to get a count of the distinct domains.
Now that we have domain counts, we can create the graph, and add it to the report.
Add the distinct domains plot to the plot created earlier.
Now we can see the link growth by looking at the number of unique sites linking to us over time.
The best part is that you can reuse the same report to analyze other sites or to keep track of your link progress. You will just need to change or update the data source. As I mentioned before, a CSV is helpful to get started with Data Studio. But for ongoing use, it is better to use BigQuery or another database as the data source. It will provide much more flexibility.
Which Pages Attract the Most Links?
To produce the reports to learn which sections of your site attract the most links, you have two options.
The first one is the simplest: just download from Search Console the list of linked pages.
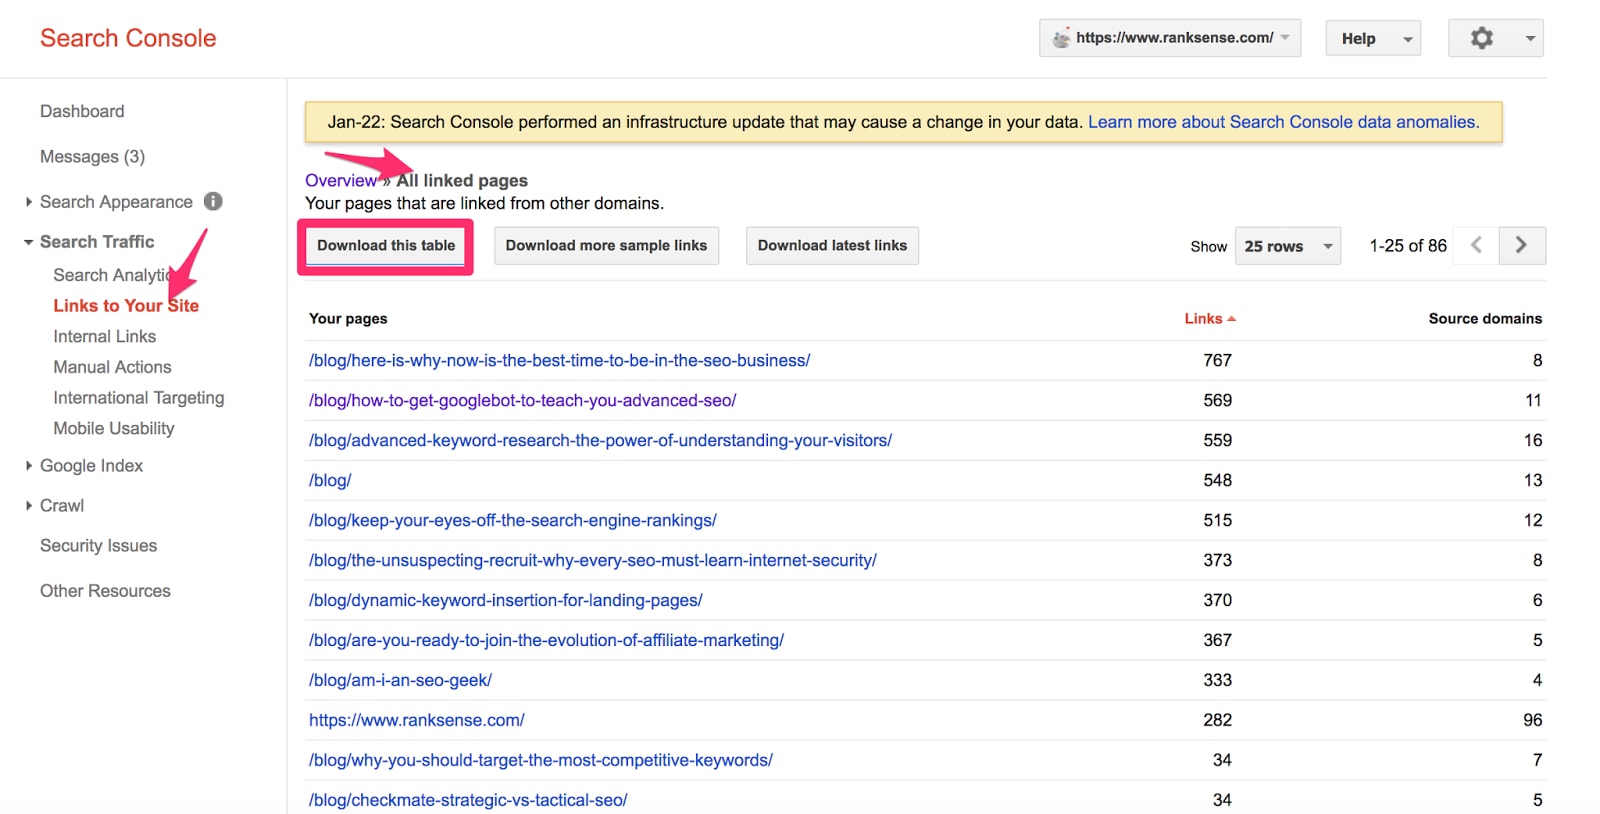
Download the top list of linked pages in Search Console.
You will see three columns: “Your pages,” “Links,” and “Source domains.” Say you want to count the domains linking to your blog versus the rest of the site. To do this, create a new dimension using a regular expression that will look for the defined term — such as “blog.” You can use a similar strategy to group your pages in any way that helps.
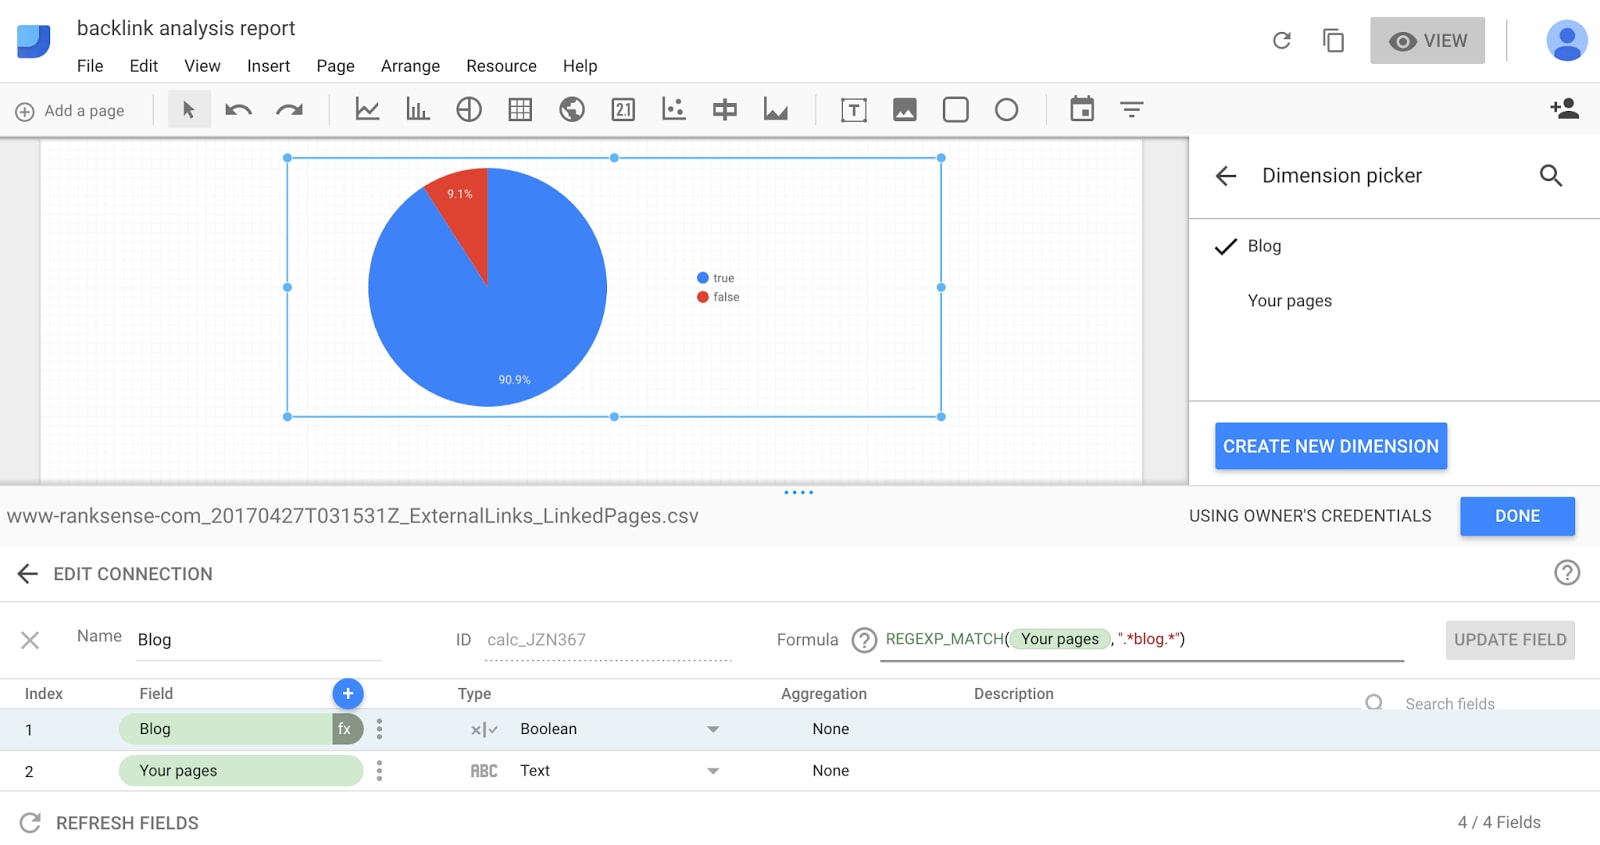
Create a new dimension using a regular expression that will look for the word “blog.”
In the case of my company, RankSense, 90 percent of links to our site are to our blog.
The second method involves crawling the list of backlinks to the site using a tool such as ScreamingFrog. One advantage of this approach is that you can check which backlinks are nofollowed — Google doesn’t consider them for ranking purposes. I will leave the analysis of this as an exercise for you to complete and to get hands-on experience in Google Data Studio.
Recommended

Remembering Hamlet Batista
February 8, 2021