Content marketing, which seeks to attract site visitors and, ultimately, customers, is one of the most popular trends in marketing. The key is producing interesting, useful, or entertaining articles, images, or video that folks will seek out.
In a 2012 article, I wrote, “Great blogs are often the result of great content in the form of a well-written post, an illuminating infographic, or an excellent video. People are attracted to the substance of the content, [and that substance] can be very difficult to reproduce when you’re trying to start or improve your business blog.”
The point was that the intangible part of content marketing is less repeatable than are other factors. In the 2012 article, I examined 17 blogs and online journals, paying attention to how often each published, the average word count for a sample of articles and posts, and the total time that the blog or journal had been publishing. In effect, I was looking for structural or easy-to-reproduce features that might have some impact on readability and popularity, and, therefore, could help marketers improve blog performance.
Now, three years later, I’ve taken another look at ten of the blogs and journals from that article to see how these structural features have changed. The results are four lessons that content marketers can learn about the structure of articles on popular blogs and online journals. Interestingly, three of the findings were unchanged.
1. Publish Often
In the small sample taken, the blogs and journals published more than once a day. This may be an indication that publishing often is an important structural feature for a successful blog or journal.
In 2012, I counted the number of posts the sample sites had published since inception. “On average the 17 blogs analyzed posted 10 times each week. On the low end of the scale, The Reddit Blog and Vistaprint’s Microbusiness Perspectives blog [which was not considered in the 2015 audit] averaged 1.5 and 1.2 posts per week through January 21, 2012 respectively. The Volokh Conspiracy was on the very high end of the scale with 63.9 blog posts per week on average.”

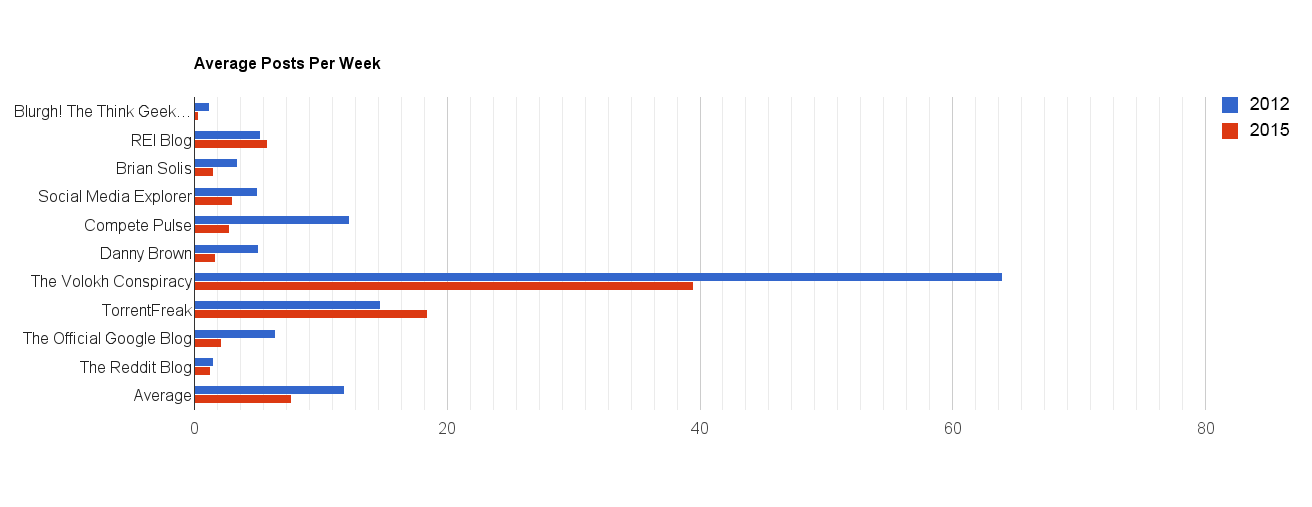
This chart shows the average posts per week from the 2012 and 2015 samples from ten sites.
But for a number of reasons, I eliminated seven of the original blogs and journals from my current sample, so that if just the remaining ten sites are considered, the 2012 average posts per week would have been somewhat more at 11.87 posts per week.
For the 2015 numbers, I counted the posts published for a 10-week period from November 30, 2014 to February 8, 2015 at noon Mountain Time. For the ten sites considered, the average number of posts per week was 7.64, or a 55-percent reduction in the average number of posts per week.
So what is this data telling us? That good blogs and journals publish often. Sure, the average number of posts per week is down a lot, but that average is still more than a post a day, as mentioned above.
One has to be careful. This site audit uses a very small sample, so that it best serves as an anecdotal look not a statistically significant one. But, nonetheless, consider publishing frequently.
2. Be Patient
This was also the second lesson in the 2012 article, and is, perhaps, even more important in 2015.
Many marketers are acting as if content marketing is a fast way to get site traffic. But it is not. Instead, it is a slow, long-term strategy that is about building lasting customer relationships.
It has been 37 months since the first time I audited these sites. Back then, the typically site was 4.8 years old. At the time the REI blog was the newest, at a bit less than two years old. It is nearly five years old now.
The lesson here is to be consistent and persistent about content marketing, for years.
3. Article Length Probably Doesn’t Matter
In the 2015 audit, the average post length was 649.3 words. To find this average, I looked at the five most recent posts for each blog. Similarly, in the 2012 audit the same ten blogs and journals had an average word count of 579.4 words.

This chart compares the average word count for ten sites audited in 2012 and again in 2015.
Yet, it would be misleading to look only at those averages, because the more striking feature of the audit in 2015 was how much word count varied from post to post.
The REI Blog, as an example, had one post as short as 122 words and another as long as 1,337 words. And if I had included a sixth article, REI’s next post back had more than 1,700 words.

The average word count probably does not tell the story properly.
Similarly, Danny Brown’s site published a 232-word post and a 3,161-word post.
While it should be stated again that this is a very small sample, it would appear that good articles come in all sizes.
4. Include an Image or Video
In the 2015 audit, I also counted the number of posts that included an image or a video. This was something that I had not considered in 2012, but which has been a topic of interest more recently.
Of the 50 posts I audited — that’s five posts from each of the ten sites — 41 had at least one image. Video was significantly less common, with just four of the 50 posts including a video. But interestingly, two of the five posts from the Google blog had video.
Overall, 90 percent of the posts reviewed include either a image or a video.
The Sites Used
Hopefully, the data from both the 2012 and 2015 audits is helpful to your content marketing efforts. Consider checking out some of these sites for yourself. Here is the list of the ten blogs and journals that I audited for the 2015 data.


